
The Bank of Canada has shocked us with only a 50 bps rate hike to 3.75% instead of to 4% that as expected while continuing on with QT. There was no color in the statement as to why they unexpectedly downshifted to a 50 bps increase after going 75 bps in September and 100 bps in July. But, they did say that “Given elevated inflation and inflation expectations, as well as ongoing demand pressures in the economy, the Governing Council expects that the policy interest rate will need to rise further” and they said that they will be closely watching the impact of these interest rate hikes on inflation and “how supply challenges are resolving.”
As for why they only went 50 bps, I’m going to guess that it is due to their worries about the housing market where many have adjustable rate mortgages (The Canada Mortgage and Housing Corp said that about 50% of home buyers went for ARM’s in the last 6 months of 2021 vs 34% in the 1st half of 2021) but they did say in their statement, “The Bank expects CPI inflation to ease as higher interest rates help rebalance demand and supply, price pressures from global supply disruptions fade, and the past effects of higher commodity prices dissipate.”
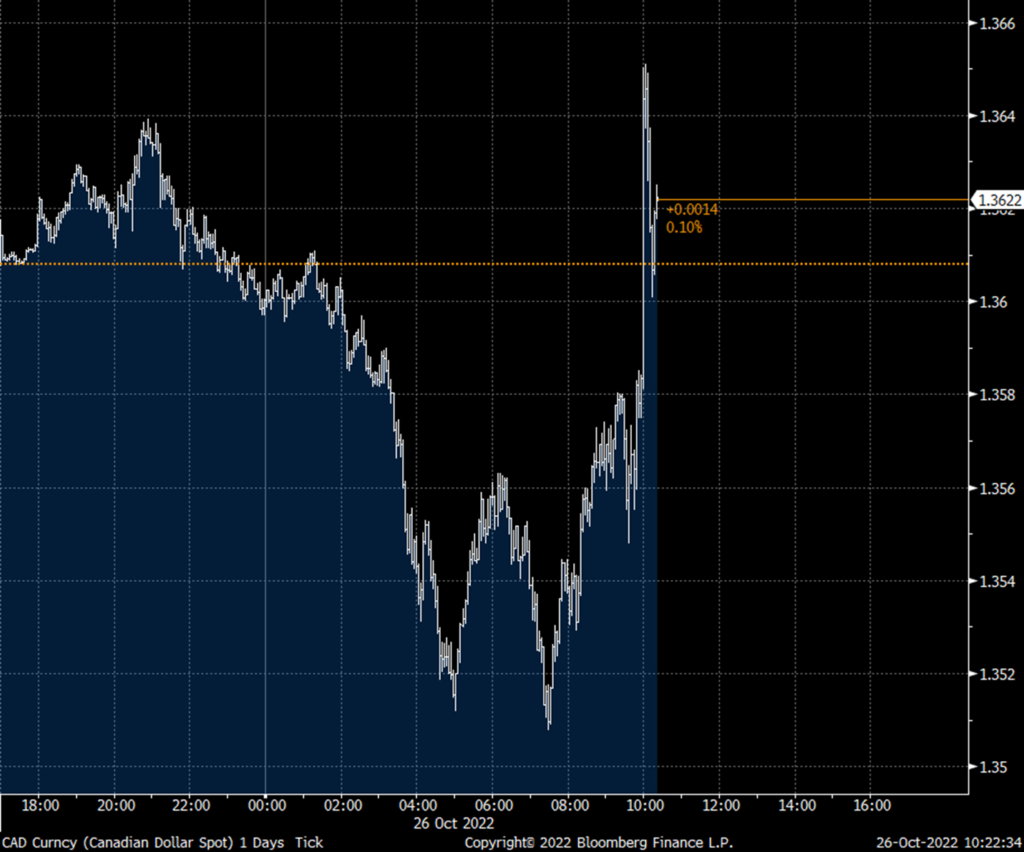
The Canadian dollar reversed lower immediately following the news but is only down slightly. The 2 yr yield is lower by 24 bps to 3.91%, a 3 week low.
The ECB is expected to hike by 75 bps tomorrow and off a base deposit rate of .75%, I don’t expect them to flinch like the BoC just did.
Intraday CAD move
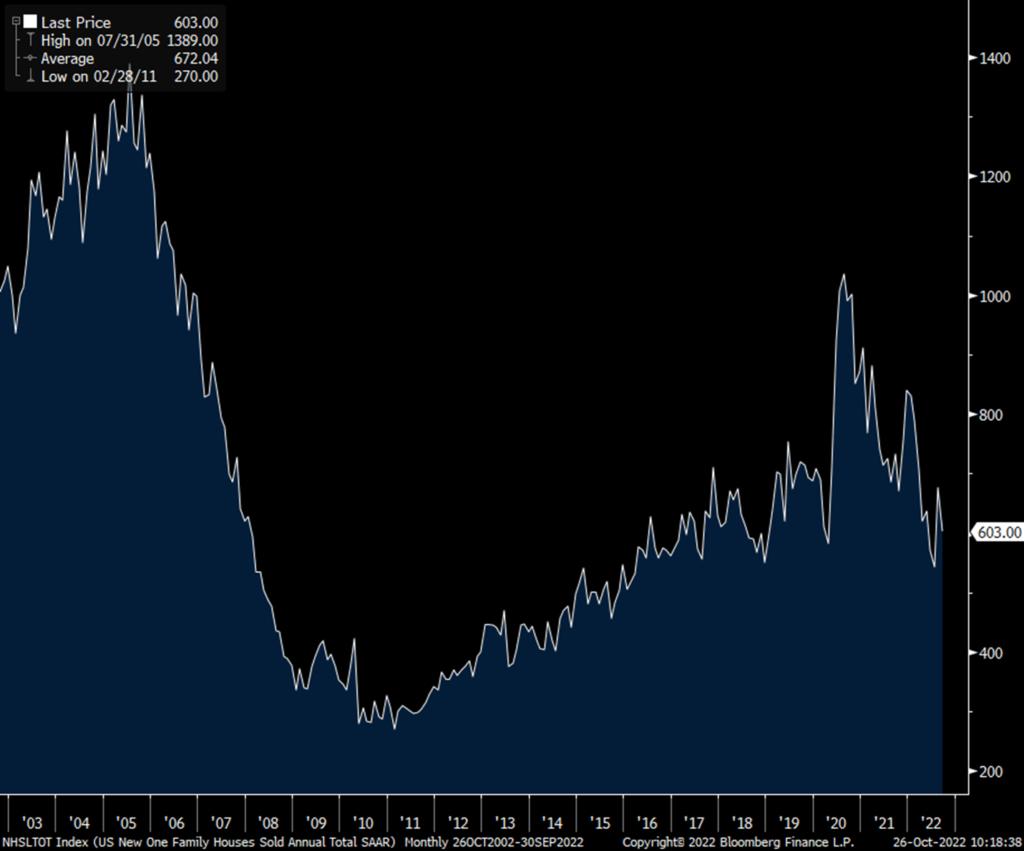
New home sales in September totaled 603k, 23k more than anticipated and vs 677k in August which was revised lower by 8k. Smoothing out this volatile data point has the 3 month average at 608k vs the 6 month average of the same 608k, the one yr average of 687k and the 2021 average of 769k. For perspective, it averaged 683k in 2019. Months’ supply (where not all of these homes are done) was 9.2, remaining very elevated. The median home price rose 14% y/o/y but also very volatile as mix skews it month to month.
The think the visual below of the number of new home sales is a good bottom line since we are clear on the macro picture for housing and the affordability challenges.
New Home Sales
Lastly, ahead of tomorrow’s GDP print, expect a cut to Q3 GDP estimates after the higher than expected September goods trade balance and slightly smaller than expected rise in wholesale inventories.
 Peter is the Chief Investment Officer at Bleakley Advisory Group and is a CNBC contributor. Each day The Boock Report provides summaries and commentary on the macro data and news that matter, with analysis of what it all means and how it fits together.