Japan
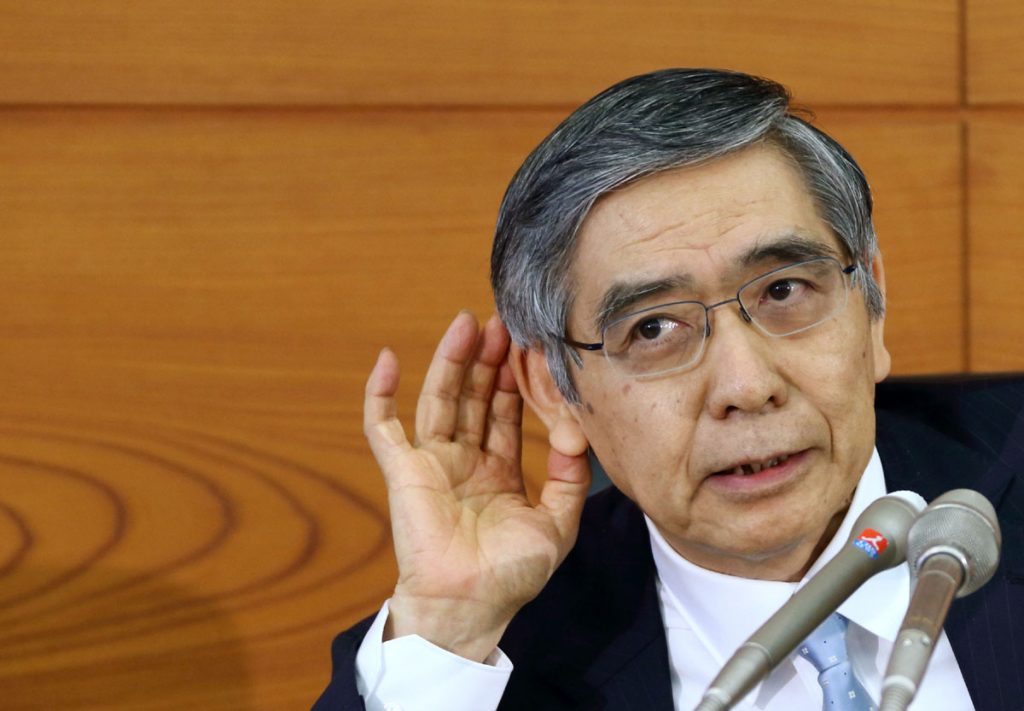
Mr. Kuroda, you finally have your 2% inflation print. Sorry though that it was for producer prices instead of the 2% cost of living increase for consumers. April PPI rose 2.1% y/o/y. Taking out the influence of the April 2014 VAT hike, it last touched 2% in January 2014. Energy, steel and electricity prices led the way. The estimate was for a gain of 1.8% but as it takes about 6 months for this to work its way into CPI, there wasn’t any market response as very long term JGB yields were unchanged. The yen too is basically flat as well as was the Nikkei overnight.
Oil
As for oil and its big influence on Japanese inflation due to their outsized imports of it and the factor it of course has for US and European inflation, the $45-55 WTI range continues as does the $50-60 for Brent with the new OPEC/Russia deal likely solidifying the lower end of that range. The Journal of Commerce index of industrial materials bottomed in January 2016 because of supply cuts in a variety of commodities rather than any notable increase in demand and that remains the predominant factor in pricing right now. There is not any movement in inflation breakevens today in response to that oil deal in the US with the 5 yr US breakeven at 1.77%, down from 2.06% back in February but still well above the August 2016 post Brexit low of 1.26%. The inflation expectation move is more notable in the UK as its 5 yr breakeven is higher by 4.5 bps to 3.06%. This compares with a .25% benchmark BoE interest rate and a 1.12% 10 yr Gilt yield. Oh, the pricing dislocations that still exist and will at some point adjust. Please tell me when. Yields are higher throughout Europe and modestly here after Friday’s CPI and retail sales induced drop.
United States
As for sentiment in US Treasuries after a week of crappy auctions, the CFTC data on Friday for the week ended Tuesday has the net speculative long position in 10 yr Treasury futures at the highest level since January 2008 after seeing the biggest net short position on record just a few months ago. Just another manic data point. See chart:
NET SPEC LONG POSITION IN 10 YR FUTURE

As we all hope for the 2nd quarter rebound after the soft Q1 and following a very mixed picture in April, we get some May US data today in the NY manufacturing survey and the NAHB builder sentiment index.
China
After a slew of softer than expected April data out of China, we got some more today. Retail sales in April rose 10.7% y/o/y, one tenth less than expected and down from the 10.9% y/o/y pace seen in March. Industrial production slowed to 6.5% growth from 7.6% in March and that was 5 tenths below expectations. Lastly, fixed asset investment ytd y/o/y was up by 8.9%, 3 tenths lower than the prior month and also 2 tenths below the forecast. It’s obvious from the data over the past few weeks that things moderated in April likely in response to a tightening of credit access via higher rates. Thus, China remains in the balancing act of wanting strong economic activity but less credit growth and that is tough to do. The weekend’s focus in China however was more on the One Belt, One Road Summit which overshadowed everything else. The H share index was higher by 1.6% which is the 6th straight day of gains which in turn also helped the Hong Kong dollar which has been very weak ytd. The Shanghai comp was up by .2% while interest rates across the board, both bonds and interbank rates, fell. The 5 yr yield though is still above the 10 yr yield as curve inversion took place late last week. What’s that saying? The yuan is also higher along with industrial commodities.
Chinese President Xi said this over the weekend, “It is our hope that through the Belt and Road Development, we will unleash new driving forces for economic growth, build new platforms for global development and rebalance economic globalization so that mankind will move closer to a community of shared future.” If you haven’t yet read about the One Belt, One Road initiative, it is a must as it is big and long lasting. Xi referred to OBOR as a “project of the century.” I saw an estimate two weeks ago from Credit Suisse that said investments could total between $300b-500b into 62 countries over the next 5 years.
 Peter is the Chief Investment Officer at Bleakley Advisory Group and is a CNBC contributor. Each day The Boock Report provides summaries and commentary on the macro data and news that matter, with analysis of what it all means and how it fits together.