Positives:
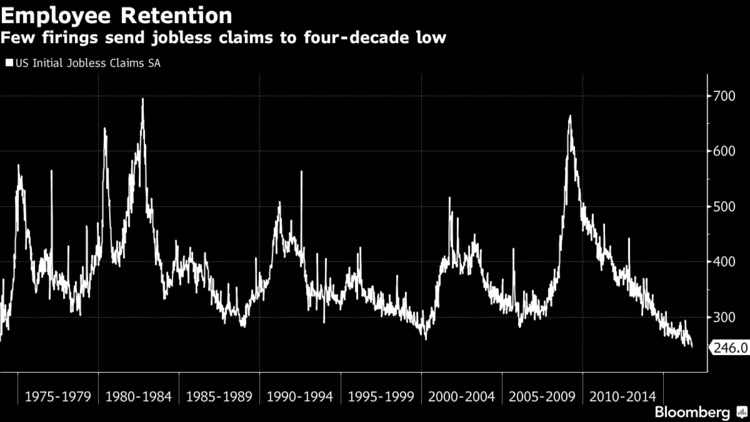
1)Initial jobless claims remained at 246k, 7k less than expected with a downward revision of 3k to last week’s number. This level of claims was last seen in 1973. The 4 week average falls to 249k from 253k last week. Continuing claims, delayed by a week, fell by 16k to the lowest level since 2000.
2)US import prices were basically unchanged in September m/o/m and were flat ex fuels. On a y/o/y basis, prices ex fuel fell .7%.
3)Business inventories in August rose .2%, one tenth more than the estimate and with a .2% sales increase the I/S ratio held at 1.39. Of note though in the discussion on peak auto’s, retail inventories of auto’s and parts rose 1.2% m/o/m and are up 10.2% y/o/y. The I/S ratio for this sector rose to 2.27 from 2.23 in July and vs 2.28 in June.
4)Producer prices in China rose .1% y/o/y in September. That was the first positive print since January 2012 and compares with the estimate of down .3%. Mining and manufacturing prices led the gain due to a stabilization and lift in commodity prices but also we are now lapping thru some from tough comparisons.
5)The October German ZEW index rose to 6.2 from .5 and that was a touch above the estimate of 4.0 and puts it back above the average year to date of 5.3. For context though, this figure averaged 31.5 in 2015. The current conditions component rose 4.5 pts to the best since January. The ZEW bottom lined the report by saying “The improved economic sentiment is a sign of relatively robust economic activity in Germany. However, positive impulses from industry and exports should not distract from existing political and economic risks. In particular, the risks concerning the German banking sector are currently a burden to the economic outlook.”
6)Germany had a 5.4% rise in exports m/o/m in August, well more than the estimate of up 2.2%. Imports were higher by 3% vs the forecast of up .7%. A key caveat however came from the statistics office that released this number as they said “comparing individual months, especially during the summer, can be misleading” due to vacations and the closures of factories during August. Exports for the Eurozone as a whole rose 2.2% m/o/m in August.
7)Italian industrial production in August surprised to the upside with a 1.7% m/o/m gain vs the estimate of down .1%. Also, July was revised up.
8)EU car registrations rose 7.2% y/o/y in September.
9)Japanese machinery orders in August fell 2.2% m/o/m but that was better than the estimate of a drop of 4.7% and compares with a gain of 4.9% in July. The y/o/y gain was 11.6%, the best since June 2015.
Negatives:
1)Looking straight at core retail sales (ex auto’s, gasoline and building materials) in September saw a gain of just .1% m/o/m, three tenths less than expected after a .1% decline in August. The strength in sales was seen in auto’s and building materials with sales gains up 1.1% and 1.4% respectively. Core sales grew by just 2.5% y/o/y, the slowest pace of gain since November 2015.
2)What followed the core retail sales miss was a cut in the Atlanta Fed GDPNow Q3 estimate to 1.9% from 2.1%. Their estimate was 3.8% two months ago.
3)The Fed’s September Labor Market Conditions Index fell to -2.2 and is now negative for the 8th month in the past 9.
4)The UoM October consumer confidence index fell to 87.9 from 91.2. That was 4 pts below the estimate and the weakest print since September 2015. Anyone watching the debates and this whole campaign would surely get depressed. Most of the confidence decline was from those who make less than $75k. The headline decline was all in the Expectations component as Current Conditions rose 1.3 pts. One year inflation expectations were unchanged at 2.4%. Household finances weakened as did those expecting higher income which fell to the lowest level since September 2014 unfortunately. After weakness seen in September, intentions to buy a car, home and major household item rose a touch.
5)PPI grew by .3% m/o/m in September and .2% ex food and energy. Both were one tenth more than expected. The y/o/y headline gain of .7% is the most since December 2014. Most of the increase was in goods, specifically energy which rose by 2.5% m/o/m. Services inflation rose by .1% m/o/m.
6)Purchase applications fell 2.6% w/o/w (the y/o/y gain of 27.3% is related to noise this time last yr on regulatory changes as last week saw a 13.7% y/o/y drop). Refi apps fell by 8% as the average 30 yr mortgage rate rose to a 3 week high.
7)Off the 2nd highest print on record, job openings fell by 388k m/o/m in August to 5.44mm. The 3 month average is 5.64mm vs the 6 month average of 5.66mm. The job opening rate fell to the lowest level since November but the hiring rate held at 3.6%. The quit rate was unchanged.
8)The September NFIB small business optimism index fell to 94.1 from 94.4. It’s now at a 4 month low as the current condition components were softer but there was some optimism about the future. The CEO of the NFIB said “We improved from awful to bad. The bottom line is that small business owners are deeply uncertain about the future, and that is affecting their decisions.” Bill Dunkelberg blamed Washington, DC. “It is quite clear the top issues for small business owners will not be addressed this year. The Presidential election is so divisive that it offers little promise of a bipartisan effort to deal with any of these important issues.”
9)Putting aside our views of what the Fed should do in coming meetings, Philly Fed President Harker brings up another excuse not to raise rates in November, implicitly saying, ‘What happens if Trump wins?’ and all the unknowns that it brings. Add this to the other list of excuses, China, Brexit, Grexit, sequester, tight financial conditions, etc…
10)The UK citizen be damned as Mark Carney said “we’re willing to tolerate a bit of overshoot in inflation over the course of the next few years in order to…cushion the blow” from a slowdown in economic growth. He’s falling for the same fallacious economic argument that Kuroda, Draghi, Yellen and most of the central banking community have. That higher inflation leads to better growth. Go ask those in Venezuela if that’s true. Bonds don’t like it either. The 10 yr Gilt yield jumped 10 bps on the week and is up by 35 bps over the past two weeks.
11)The September Chinese exports in dollar terms fell 10% y/o/y, three times more than expected and they also fell by 5.6% in yuan. Imports fell by 1.9% y/o/y vs the forecast of a rise of .6%. They did though rise 2.2% in yuan terms. The sharp drop in exports brought their trade balance to a 6 month low. In dollars, exports fell across the world. China’s demand for commodities still remains pretty healthy however. In volume terms, the import of iron ore was the 2nd highest level ever. Crude oil imports were also the 2nd highest on record and up 14% ytd y/o/y. Copper imports moderated to the lowest since February ’15 but on a ytd y/o/y basis they are still up 12%.
12)Consumer prices in China in September were up by 1.9% y/o/y, up from 1.3% in August and above the estimate of up 1.6%. Food prices jumped 3.2% y/o/y but also non food prices accelerated to a 1.6% y/o/y rise, the biggest gain since June 2014.
13)The private sector weighted Chinese services PMI fell a hair to 52 from 52.1 in August. Caixin said “Service sector activity continues to expand modestly.”
14)Foreign direct investment in China in September rose 1.2% y/o/y but that was below the forecast of 3.2%.
15)Collateral damage from the Chinese economic slowdown was clearly felt in Singapore in Q3. The Singapore economy contracted at a 4.1% q/o/q annualized pace, well worse than the estimate of up .1% and grew just .6% y/o/y vs the estimate of up 1.8%.
 Peter is the Chief Investment Officer at Bleakley Advisory Group and is a CNBC contributor. Each day The Boock Report provides summaries and commentary on the macro data and news that matter, with analysis of what it all means and how it fits together.