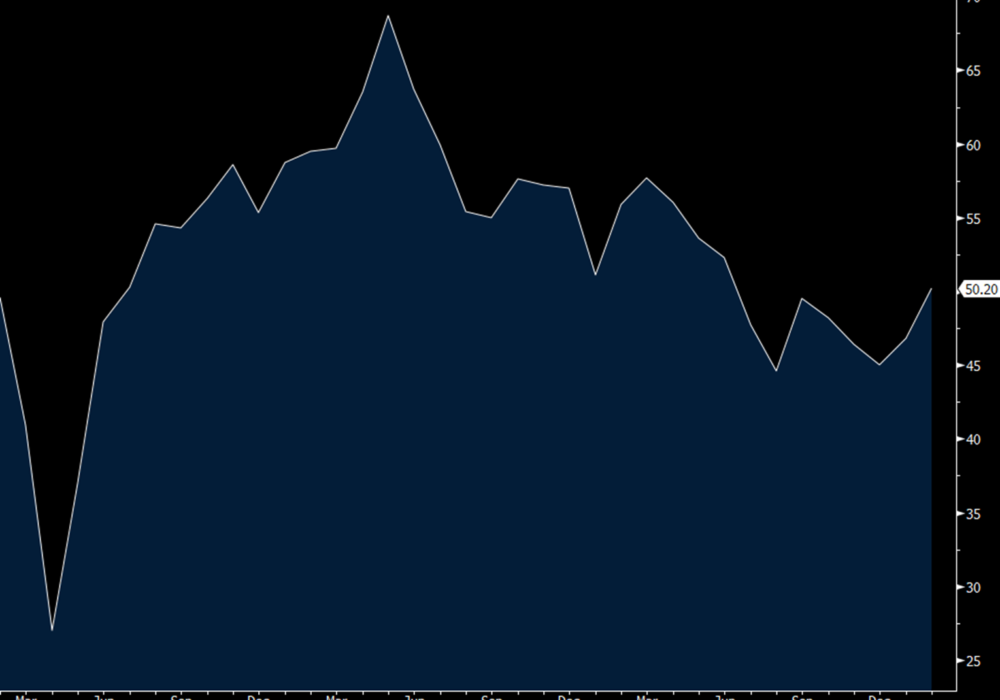
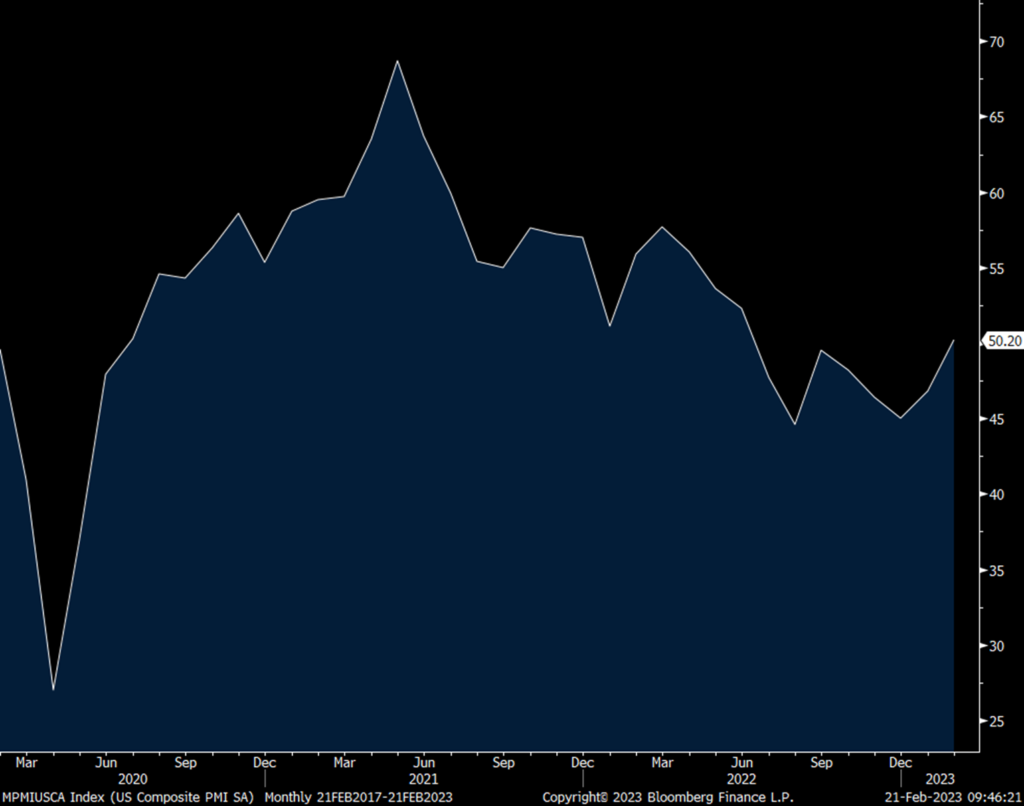
The S&P Global February manufacturing and services composite PMI finally got back above 50, albeit slightly after 7 months in contraction. It rose to 50.2 from 46.8 and was mostly led by a lift in the services component which got to 50.5 from 46.8. S&P Global is specifically saying the mild winter weather likely helped out. Manufacturing remained below 50 at 47.8 vs 46.9 in the month before.
With services, this is the first time out of contraction since last June. S&P Global said though that “The pace of growth was only marginal, however, as some firms continued to highlight customer hesitancy following hikes in interest rates and inflation.” New orders improved but were still just below 50. Export orders were soft “as firms highlighted challenging demand conditions in key export markets.” Price pressures eased but “remained historically elevated” and similar to what we heard in the Eurozone and UK PMI’s, “Anecdotal evidence stated that wage pressures were the main driver behind higher cost burdens.” And, while input prices eased, “The rise in selling prices was the quickest for four months and strong overall.” Employment picked up to the highest since September 2022, “albeit only modest overall.” The overall outlook was optimistic as “The level of positive sentiment was the strongest since May 2022, as firms hoped that new sales initiatives and new product offerings would spur demand.”
Manufacturing was less weak. “The marginal fall in output stemmed from weak client demand, as new orders decreased sharply. Some companies noted that sufficient stocks at customers and high inflation dampened demand conditions.” As seen in services, exports were soft as “The solid decline in foreign client demand was linked to inflationary pressures in key export markets.” Also as seen in services, input costs moderated again but “firms recorded a steeper rise in selling prices.” Employment picked up to the best since last September, also as seen with services, but still at a “modest rate.” Backlogs remained below 50. The business outlook here remained positive too notwithstanding the current weakness “and focused inventory reduction.”
I’ll leave the bottom line to S&P Global, “February is seeing a welcome steadying of business activity after seven months of decline. Despite headwinds from higher interest rates and the cost of living squeeze, the business mood has brightened amid signs that inflation has peaked and recession risks have faded. At the same time, supply constraints have alleviated to the extent that delivery times for inputs into factories are improving at a rate not seen since 2009.” I think not stated here because it still remains to be seen how this plays out outside of the immediate impact on housing and its growing impact on the auto sector for lower income buyers is the higher for longer interest rate world we’re in that will broaden out in its influence.
Treasury yields are at the highs of the day in response to the stemming of 7 months of below 50 prints.
US PMI
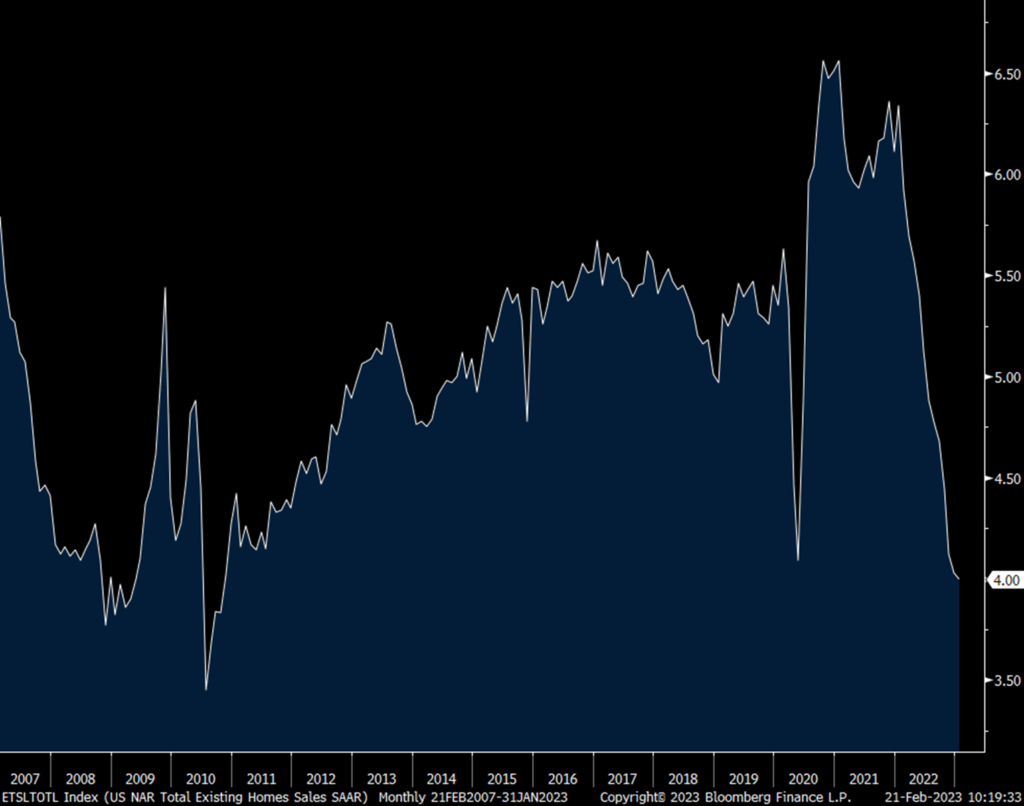
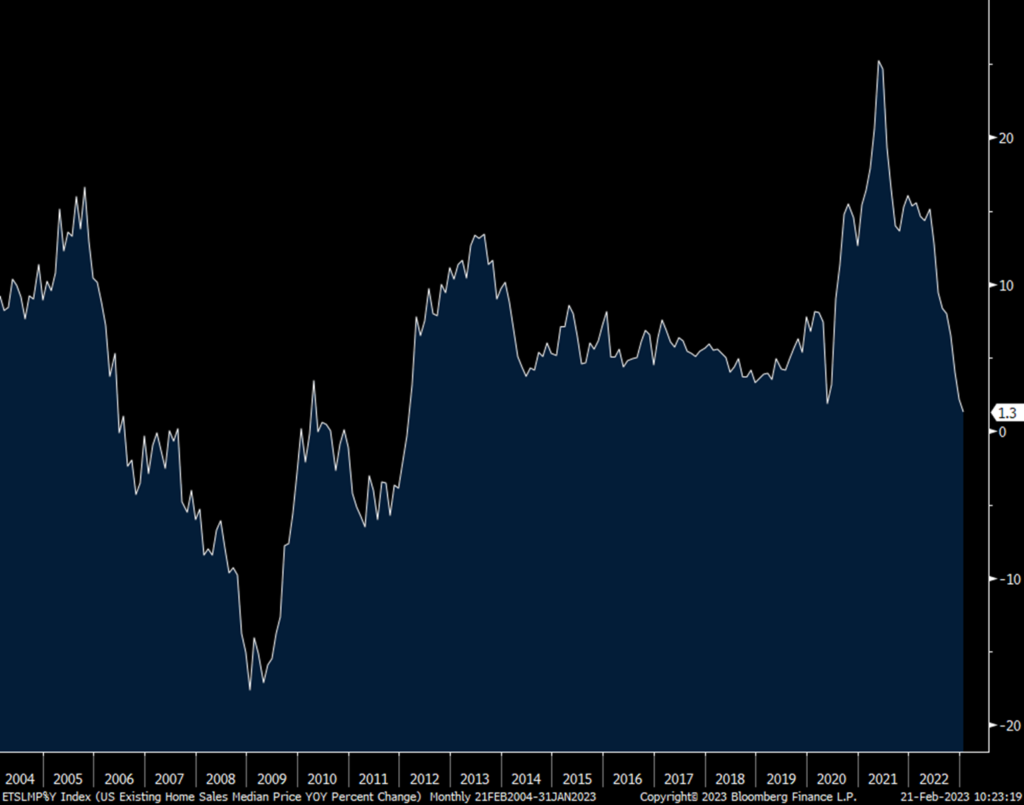
Existing home sales in January totaled 4mm on the dot annualized, down a touch from 4.03mm in December and 100k below expectations. This is the smallest number of home closings since November 2010 for reasons we all know with challenging affordability at the same time inventory is limited. Months’ supply fell at 2.9 which compares with the average of 5.9 months in the 20 years leading into Covid. The median home price slowed to almost unchanged, up 1.3% y/o/y. First time buyers were 31%, the same seen in December but up from 27% one year ago. For those who don’t need a mortgage, all cash buyers made up 29% of purchases vs 28% in December and 27% last January. I can’t find a higher number of cash buyers.
The NAR talked about the divergence in markets where pricing differentials are notable. They said “Prices vary depending on a market’s affordability, with lower priced regions witnessing modest growth and more expensive regions experiencing declines.” While inventories are still low, the NAR said “buyers are beginning to have better negotiating power. Homes sitting on the market for more than 60 days can be purchased for around 10% less than the original list price.”
I’ll add again, the only question at this point, as long as mortgage rates stay above 6%, is how much do home prices need to fall in order to mitigate the affordability crunch. This will be the key determinant, in addition of course to the direction of mortgage rates from here (have they topped or not, not for now), in dictating the number of transactions this year. Either way, that pace is now at 13 yr lows as of January.
Existing Home Sales
Median Home Price y/o/y
 Peter is the Chief Investment Officer at Bleakley Advisory Group and is a CNBC contributor. Each day The Boock Report provides summaries and commentary on the macro data and news that matter, with analysis of what it all means and how it fits together.