The July ISM services index fell 1 pt to 55.5 which was a touch below the estimate of 55.9 but is still above the average year to date of 54.6. This compares with the 2015 average of 57.2. New orders rose .4 pts to the best since October at 60.3 although there was a drop in the number of companies seeing an increase to 13 from 15 surveyed in June. Backlogs rose 3.5 pts to 51 after dropping by 2.5 pts in June and puts it back to its 6 month average. Employment fell 1.3 pts to just above 50 at 51.4. Export orders, where only a few service companies report them, rose 2.5 pts to 55.5. Prices paid fell 3.6 pts but at 51.9 is just in line with the half year average. Similar to June, 15 industries saw growth of the 18 surveyed. The ISM summed up the report by saying “the majority of the respondents’ comments reflect stability and continued growth for their respective companies and a positive outlook on the economy.”
Bottom line, reading the ISM release and one gets the impression that everything is copacetic but Markit’s version of services is more guarded as their index is barely above 50. In their release today where the index was 51.4 vs 50.9 in June they believe Q3 growth is holding “at around 1%” which is what was seen in the 1st half of 2016. Hopes for a rebound in Q3 is evident though as business confidence about the outlook rose to the best since January. The truth on growth lies somewhere in the middle between ISM and Markit but the reality on growth this year is that it will have a 1 handle on it, the slowest pace of gain in years.
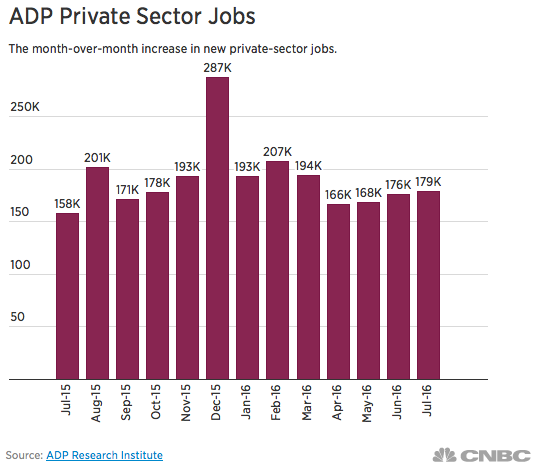
ADP said that in July a net 179k private sector jobs were created, a bit better than the estimate of 170k and up from 176k seen in June (revised from 172k). All of the gains were seen in the service sector as it contributed 185k jobs but that is down from 203k in June. The goods side saw job cuts of 6k but not as bad as the 27k lost in June. Construction shed jobs for a 2nd month while manufacturing added 4k jobs after shedding 15k in June. ADP is attributing some of the overall job growth slowdown to small businesses “as the labor market continues to tighten, small businesses may increasingly face challenges when it comes to offering wages that can compete with larger businesses.”
Bottom line, notwithstanding the better than expected print, the slowing hiring trend continues. The 3 month average job gain is now 174k and the 6 month average is 180k. These figures compare with job growth of 207k in 2015 and 234k in 2014. On one hand, employers are running out of qualified warm bodies to hire but also, slowing profits and shrinking profit margins don’t lend itself to a pick up in hiring.
China’s private sector weighted services PMI index fell 1 pt to 51.7 which is about in line with the year to date average of 51.9. This follows the improvement in their manufacturing index and Caixin said this about the services sector, “All of the index categories showed signs of deterioration, with employment falling back into the territory of contraction after 3 consecutive months of growth.” Japan’s services index rose 1 pt to barely back above 50 at 50.4. Hong Kong’s PMI rose 1.8 pts but to only 47.2 as the Chinese slowdown continues to weigh. Singapore’s PMI fell by 1.6 to near 50 at 50.7. India’s services bounced 1.6 pts to 51.9. Bottom line, Asian PMI’s for both services and manufacturing continue to hover around 50, give or take a few points. Asian stock markets were weak across the board and sovereign bond weakness followed what was seen yesterday in Japan, Europe and the US. In particular, the Australian 10 yr yield jumped by 11 bps.
The services PMI for Europe was revised to 52.9, a touch better than the first read of 52.7 and is up .1 from June but that was the slowest pace of expansion since January ’15. This brings the services and manufacturing composite index to 53.2 from 53.1 in June. With services, “all of the ‘big four’ national services economies reported growth of business activity, incoming new orders and employment during July. However, optimism regarding future performance fell to a 19 month low with business confidence easing across Germany, France, Italy and Spain.”
The UK services PMI for July, a post Brexit print, fell to 47.4 from 52.3. This is a downward revision from the initial July print of 48.8 as “services output and new business both fall at the fastest rates since March 2009” and “expectations fall to the weakest since February 2009.” This data point continues a string of very weak sentiment data but we need more time to see if this is a knee jerk emotional response to the UK vote or something more longer lasting because of all the unknowns to come. With the BoE meeting tomorrow, are they going to expend what little bullets they have left for a hoped for reward that is likely specious with rates already so low? Will they essentially give in to peer pressure to ‘do something’ or acknowledge there is not much more they can do? The pound and gilt yields are little changed as the market has about fully priced in a 25 bps rate cut.
Retail sales in the Euro region in June was flat m/o/m, in line with the estimate and the y/o/y gain of 1.6% matches what was seen in May. These numbers are pre UK vote and there is an important standoff between the European consumer and the ECB. The consumer is dealing with sluggish wage growth, decent job growth and terrorism fears while the ECB is trying to drive higher their cost of living.
With it being a constant focus, the euro STOXX bank index is rebounding by 1.4% after the 7.5% drubbing in the prior 2 days. ING and Soc Gen are leading the way after earnings and the Italian banks are up as well after an ugly few days.
After a rough 3 days, most JGB’s were little changed overnight with the 10 yr yield at -.08%. However, yields for longer dated paper rose again as the Japanese government said they were going to issue more 40 yr JGB’s. Smart to term out that far with rates so low but it also brings extra supply. The Nikkei fell another 1.9% to a 3 week low. Question to all those Keynes lovers over the past 25 years, what’s next?
In the US, mortgage applications to buy a home remains very uneven. They fell 2.4% w/o/w and are down for three straight weeks and the y/o/y rise slowed to 6%. The housing recovery continues but still in a choppy fashion. The index is at the lowest level since February. Refi applications fell 4.2% w/o/w, down for a 3rd week but are still higher by 56% y/o/y.
Stock market sentiment according to II changed only a bit. Bulls fell 1 pt to 52.9. Two weeks ago it hit the highest since April 2015 at 54.4. Bears though also fell by .4 pts to a 14 week low at 21.2. The bull/bear spread thus narrowed by .6 pts off the widest since July 2015. The Correction side is where everyone went as it was higher by 1.4 pts to 25.9. Two weeks ago it touched the lowest since June 2014. Bottom line, sentiment is still pretty giddy and showing little fear in the face of an extraordinary amount of risk in my opinion.
 Peter is the Chief Investment Officer at Bleakley Advisory Group and is a CNBC contributor. Each day The Boock Report provides summaries and commentary on the macro data and news that matter, with analysis of what it all means and how it fits together.