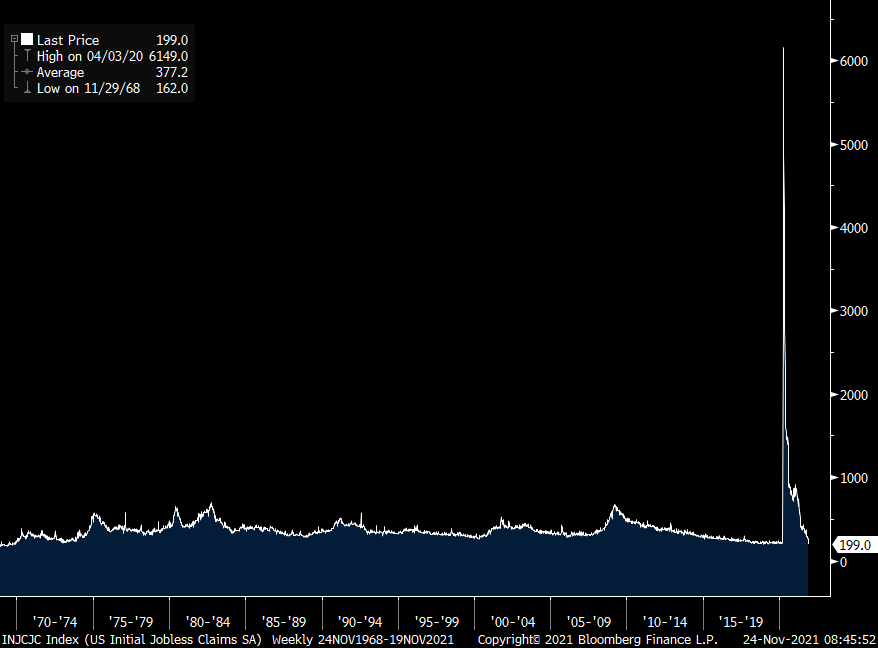
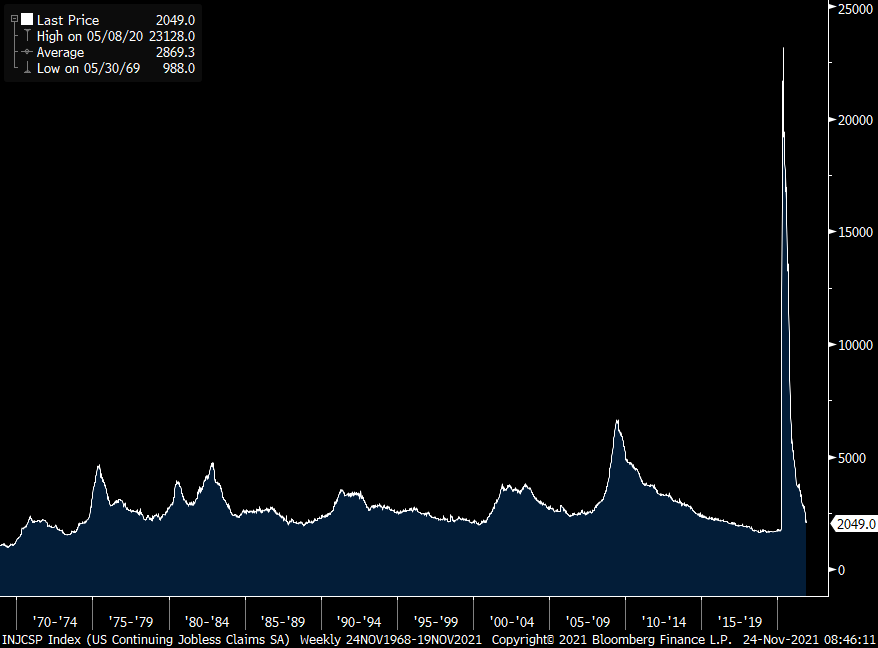
Initial jobless claims fell to just 199k, well below the estimate of 260k and down from 268k last week. That is a print I’ve never seen so low while alive as it printed less than 200k in the summer of 1969. It got as low as 206k in January 2020. This brings the 4 week average to 252k from 273k. Delayed by a week, continuing claims fell by another 60k to a fresh post Covid low at 2.049mm.
Bottom line, while claims have been trending down as employers keep a tight hold on to their employees because of the labor shortages, I do have to wonder how much of the huge fall relative to consensus has to do with the holidays and seasonal adjustments. Either way, the trend is clearly down.
INITIAL CLAIMS
CONTINUING CLAIMS
Core durable goods orders in October rose .6% m/o/m, one tenth more than expected and September was revised up by 5 tenths to a 1.3% increase. After two months of declines, orders for vehicles/parts rebounded by 4.8% but are still down 4% y/o/y. Orders for computers/electronics and electrical equipment were higher as they were for metals. Machinery orders fell by .9% m/o/m and I wonder how much the Deere strike was an influence there, or not.
Core shipments which gets plugged into GDP was 2 tenths less than expected and September was revised down by one tenth so maybe we see a slight tweak lower for Q4 GDP estimates even though they remain high. That Atlanta Fed is at 8.2% vs the 2nd revision to Q3 GDP which printed 2.1% today.
Bottom line, this data doesn’t include spending on software and we know companies are spending a lot on it. As for capital spending elsewhere, on one hand companies are trying to get more efficient with all aspects of their business, especially now with so many cost pressure pain points. That said, because of the limited visibility on what is going on out there and how long all this will last, some are husbanding cash instead.
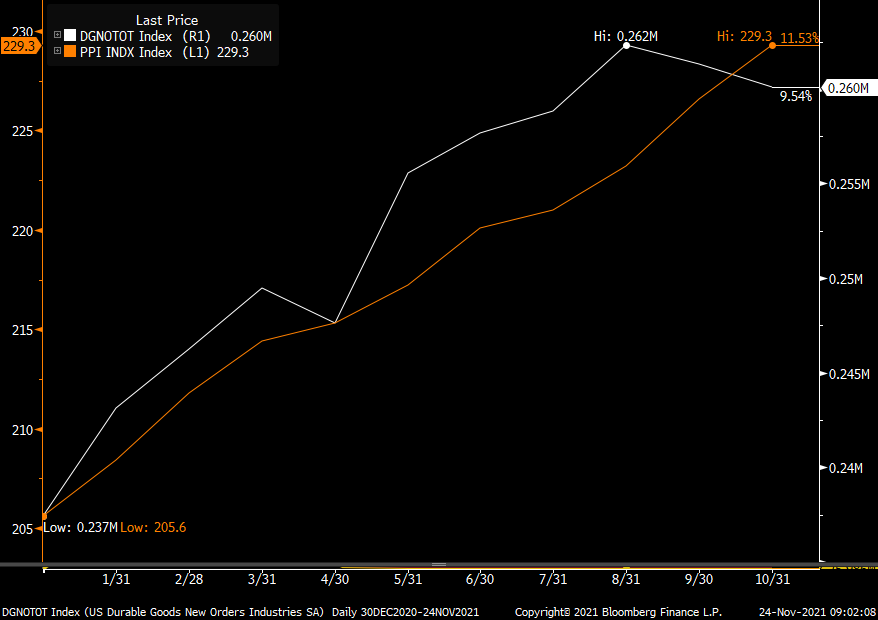
Lastly, and the caveat here, these are nominal numbers. For perspective, headline durable goods orders year to date are up 9.5%. The producer price index is up 11.5% so back of the envelope has a decline in REAL capital spending.
DURABLE GOODS ORDERS in white, HEADLINE PPI in orange
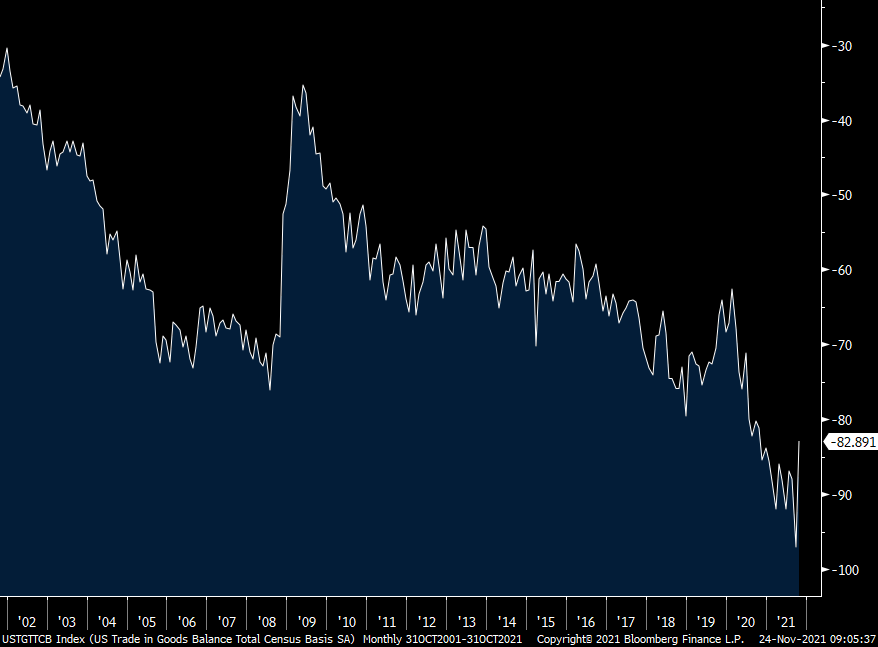
Likely boosting Q4 GDP estimates was the sharp fall in the goods trade deficit in October because of a jump in exports of 10.7% m/o/m relative to a .5% rise in imports. Exports of food/beverage, industrial supplies, and auto’s led the way. The deficit came in at $82.9b off the record high of $97b in September and vs the $95b estimate.
GOODS TRADE DEFICIT
 Peter is the Chief Investment Officer at Bleakley Advisory Group and is a CNBC contributor. Each day The Boock Report provides summaries and commentary on the macro data and news that matter, with analysis of what it all means and how it fits together.