February payrolls grew by a net 678k, well more than the estimate of 423k and the two prior months were revised up by 92k. Of this, the private sector contributed 654k. The household survey said 548k jobs were added and when combined with an increase in the size of the labor force of 304k, the unemployment rate fell to 3.8% from 4% in January and 3.9% in December. This is the lowest since the 3.5% print pre covid. The all in U6 rate was 7.2% vs 7.1% in January.
There was help from the leisure/hospitality sector which led the gains as job hiring totaled 179k vs 167k last month and vs 186k in the month prior. Healthcare hiring also picked up. Trade/transport remained robust for reasons we all know. Construction added 60k after just 7k in January and vs 44k in December. Manufacturing hiring rebounded too.
The participation rate ticked one tenth to 62.3% which also is the lowest since March 2020 when it was at 62.7% and 63.4% in February 2020. The employment to population ratio rose to 59.9% from 59.7% and that matches March 2020 but still below February 2020 when it saw 61.2%.
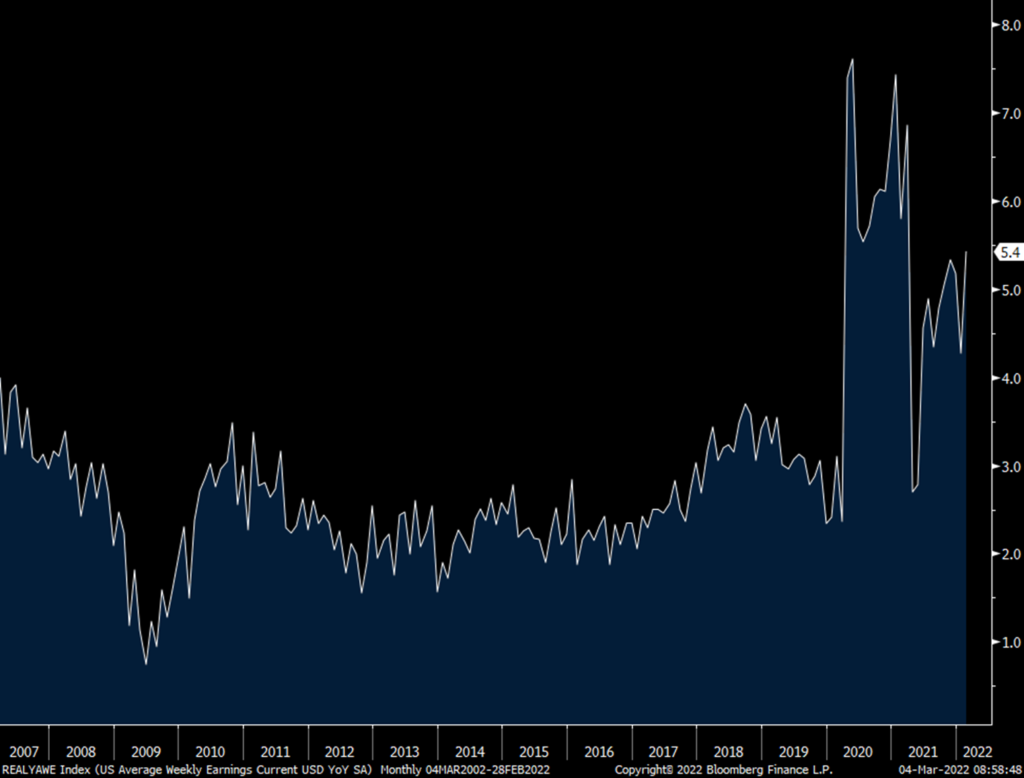
There was disappointment with the wage data as average hourly earnings were flat m/o/m instead of rising by .5% as forecasted. Pay fell m/o/m for the key sectors of leisure/hospitality and manufacturing but rose in construction and trade/transportation/utility group. For the other important cohort of ‘professional and business services’, wages rose just .1%. Versus last year average hourly earnings were still up 5.1% and hours worked did tick back to 34.7 after falling to 34.6 in January from 34.8 in December. Combining the hourly earnings with the hours worked puts average weekly earnings up .3% m/o/m and 5.4% y/o/y.
I will argue this on the wage figures today, omicron really screwed up employee schedules and timing of wage pay in December thru February so I would rely less on hourly earnings and more on weekly earnings here because of the large influence of leisure and hospitality in the mix of hourly earnings. Manufacturing, which had plenty of people calling out sick over the past few months, also of course dealt with all the supply problems which continued to shut auto factories for example weeks at a time because of a shortage of parts.
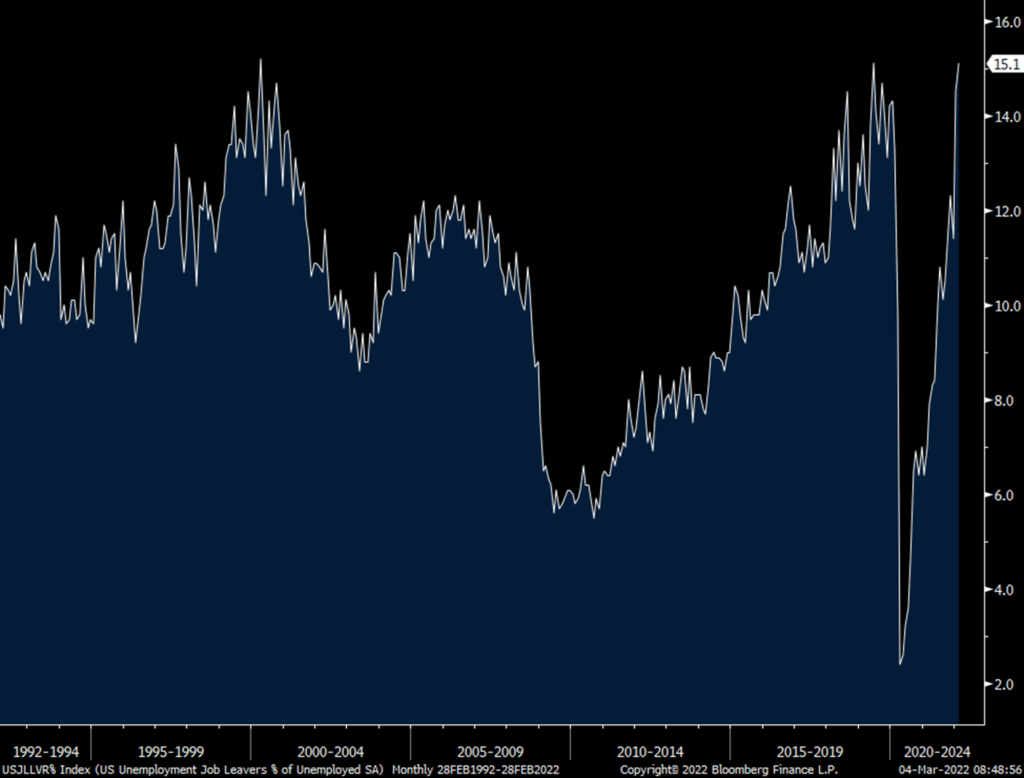
To the tightness of the labor market and the leverage that employees think they have, ‘job leavers’ as a % of the unemployed rose to 15.1% from 14.5% and that matches the highest since April 2000.
Bottom line, smoothing out the adjustments last month and the influence of omicron puts the 3 month hiring average at 582k vs the 6 month average of 583k and the 12 month average of 556k, so pretty consistent. The question of course what happens from here as we know there is high demand for labor but an even more cloudy outlook in terms of business visibility. Notwithstanding today’s wage print, which I tried to explain away, employees have more leverage and wage growth is strong as seen by the 5.4% average weekly earnings. But as U2 sang, many at best are just Running to Stand Still because of 40 yr highs in inflation. //www.youtube.com/watch?v=FvUI-s4Azw4, one of my all time favorites.
Average Weekly Earnings
Job Leavers as % of Unemployed
 Peter is the Chief Investment Officer at Bleakley Advisory Group and is a CNBC contributor. Each day The Boock Report provides summaries and commentary on the macro data and news that matter, with analysis of what it all means and how it fits together.