
I just sat down with Guy Adami and Dan Nathan for the first of many podcasts for The Boock Report. It’s about 45 minutes long and we cover the FOMC statement tomorrow, what other Central Banks like the ECB and BoJ are doing. And ultimately what it all means for the dollar, yields, commodities, equities and the economy as a whole. I specifically discuss what was in the last FOMC statement and what to look for tomorrow. I believe the Fed may start becoming more hawkish in there choice of language and that may have an effect on risk assets even though the market is pricing in such a small chance of rate hikes before the election in November. You can listen in on the entire discussion here:
Flash version:
MP3 version:
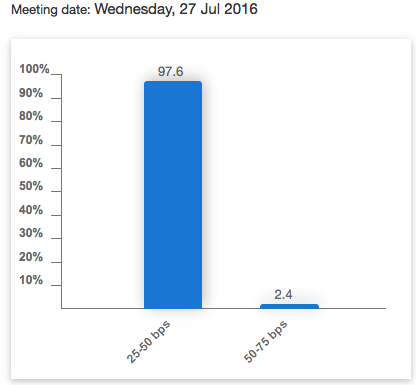
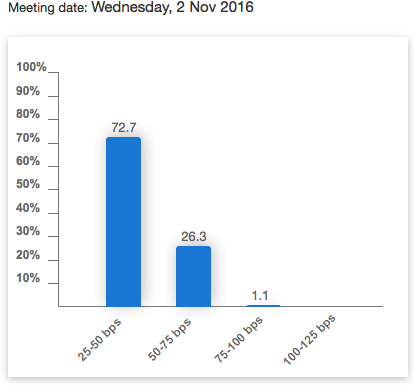
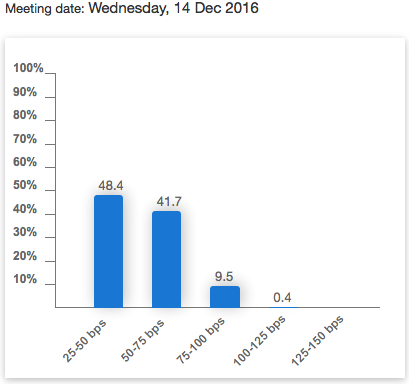
The following is the odds the market is placing on the path for the Fed for the balance of 2016. As you can see tomorrow’s meeting is basically in “no chance” territory. But things get more interesting into the end of the year:
How about the data today ahead of tomorrow’s Fed Statement?
After a bad 2 yr note auction yesterday, the 5 yr today was equally poor. The yield of 1.18% was well above the when issued of 1.16-.165%. The bid to cover of 2.27 was below the previous 12 month average of 2.44 and the weakest in 7 years. Also, dealers got stuck with almost 42% of the auction vs the one year average of 33%. That is the most since August 2015.
Bottom line, the demand for short term US paper really dried up over the past 2 days. What is this saying about tomorrow’s Fed statement? What happened to the demand for yield? What happened to all that foreign buying? In response, the 2 yr note yield is touching .78%, exactly where it was the day of the UK referendum on June 23rd. The 5 yr yield of 1.15% compares with 1.26% on June 23rd and 1.07% on June 24th.
The yen is rallying to a 2 week high and is also at its pre Brexit level as stimulus junkies are realizing that the size of the fix may not be what they hoped for. To say expectations are high for another big round of stimulus is an understatement. The Japanese Finance Minister Aso said they are still unsure on the total size of the fiscal package and he also said monetary policy should be best left with the BoJ implying no coordination. For the all the focus on the 1st two arrows of Abenomics, the most important 3rd arrow has gotten completely lost unfortunately. Tax and labor market reform are the keys to faster economic growth, not more of the same on the fiscal and monetary front that has been essentially ongoing for decades. The Nikkei fell 1.4% overnight to a 2 week low.
The US 2 yr note yield is up another 1 bp to .75% after yesterday’s awful auction, the highest since the day of the June 23rd UK vote. The odds of a rate hike by yr end are also at the most since June 23rd at 46%. The 2s/10s spread is down another 4 bps and lower by 8 over the past 3 days to just 80 bps. It was at 96 bps on June 23rd. Today we see the July Markit PMI services index, July consumer confidence, July Richmond manufacturing survey and June new home sales.
In Europe, bank stocks continue to trade terribly with the Euro STOXX bank index back to a 2 week low led by a 5% decline in Commerzbank after an earnings update. Italian banks are weak as well. With the ongoing damage being done to the profitability of many global banks with interest rates where they are, how will it be possible not to see further economic weakness. We eagerly await the results of the ECB bank stress tests this week.
The pound is down slightly after BoE member Martin Weale said he is now leaning towards more monetary action (it stopped being an actual economic stimulant a while ago) after seeing the very weak PMI numbers last week. Just two weeks ago he said he was in no rush to act. Patience and humility with what they can do after everything that has already been done is still nowhere apparent. RBS is out today in a letter to its business clients that if the BoE goes down the NIRP road, it “could result in us charging interest on credit balances.”
Hong Kong exports fell for the 15th month in the past 16 y/o/y. They fell 1% in June from last year and that was a bit better than the estimate of down 1.6%. While China said imports from Hong Kong in June rose 71% y/o/y, Hong Kong said exports to China were up just 1.8% y/o/y. Hong Kong exports fell 7.3% to the US, by 10.3% to the UK and by 8.2% to Japan. Exports to Germany were up 1% y/o/y. Imports fell by .9% but that was much better than the forecast of a 5% drop. Looking ahead, the government said “the external trading environment remains challenging given the uncertainties associated with the outcome of the UK referendum in favor of leaving the European Union, slow recovery in the advanced markets, monetary policy divergence among major central banks and heightened geopolitical tensions in various regions.” The Hang Seng index was up by .6% and mainland indices rallied as well.
The Markit PMI services index for July slowed to 50.9, a 5 month low and down from 51.4 in June. It’s also the 2nd lowest print in years. New orders fell but employment was up slightly. Also, “business sentiment improved markedly from June’s record low.” Markit summed up the report by saying “The US service sector remained stuck in a low gear at the start of the third quarter of 2016, with growth of activity remaining subdued amid a slower rise in new business. This is particularly disappointing given the decent numbers posted by the manufacturing sector last week. A bit more encouraging was the rebound in business confidence following June’s survey low, suggesting that a return to stronger growth will be possible once the current soft patch comes to an end. Whether this will be before the presidential election or not remains to be seen, however.” As the market cares much more about the ISM figure, this figure is not a focus today but points to the still mediocre US economic growth rate.
The Conference Board’s consumer confidence index fell a hair to 97.3 in July from a revised 97.4 in June (revised from 98) but that was slightly better than the estimate of 96. The Present Situation component rose to the best level since September but Expectations moderated a touch. As for the answers to the labor market questions, those that said Jobs Were Plentiful fell .2 pts to a 5 month low but those that said jobs were Hard To Get were down by 1.4 pts. Overall employment expectations were about flat. After jumping by 1.7 pts in June, Income expectations fell by 1.6 pts. Consumer spending plans were subdued. Those that plan to buy a car fell almost 2 pts to the lowest level since October while those that plan to buy a home rose just .1 pt off the lowest level in a year. Also, buying plans of major household items rose only marginally from a 5 month low. One year inflation expectations fell one tenth to 4.7%. Business conditions were mixed to slightly better. Bottom line, the data is “suggesting the economy will continue to expand at a moderate pace” while “consumers remain cautiously optimistic about growth in the near term” according to the Conference Board.
New home sales in June totaled 592k annualized, 32k more than expected and up from 572k in May which was revised up by 21k. Sales now are at the most since February ’08 and continue to creep closer to the 25 yr average of 715k. Sales in the South and Northeast were flat m/o/m but lifted in the Midwest and West. As sales exceeded the increase in the number of homes for sale, months’ supply fell to 4.9 from 5.1. The median price was up by 6.1% y/o/y to back above $300k. Bottom line, with the dearth of inventory in some markets it is nice to see a lift in the sale of new homes but there still is a modest pace of sales for lower price homes where first time households need to see. A reason for that is the growing cost of lots, labor and fees that crimp the margins of selling a home for less than $250k. It was homes priced between $400-500k that saw the biggest lift as sales priced below that price fell m/o/m. I’ll say again, the housing market continues its recovery but still in an escalator type fashion rather than something more linear. In terms of historical rates, there still is a lot of catch up to be had.
The July Richmond manufacturing survey improved by 20 pts to +10, well better than the estimate of -5. Smoothing out the volatile nature of this number puts the year to date average to 4 vs 2 last year. New orders and shipments were up while backlogs were flat. Employment was up a touch and interestingly, “firms continue to report wage increases.” As for the future, “firms expected moderate growth in shipments and in the volume of new orders.” This included “mild growth in the number of employees.” Bottom line, Richmond has been the best manufacturing region so far in July as NY flat lined, Philly was down and Dallas was much less bad. Next week’s ISM is expected to print 53 vs 53.2 in June.
According to the Case Shiller home price index, prices fell for a 2nd straight month but only by the slightest amount. On a y/o/y basis, prices were higher by 5.2% but that was the slowest pace of gain since September. Robust price gains were seen in Portland, Seattle, Denver and Dallas. NY and DC were the main laggards. Bottom line, the seasonally adjusted 20 city index is just below the highest level since October ’07 and is just 9% from the 2006 peak. As I’ve stated in the past, I’m actually rooting for a slower pace of home price gains because too many households have been priced out. With persistent rent gains now reaching a point where monthly payments aren’t much different than mortgage payments, a slower pace of home price gains could help catalyze new purchases.
 Peter is the Chief Investment Officer at Bleakley Advisory Group and is a CNBC contributor. Each day The Boock Report provides summaries and commentary on the macro data and news that matter, with analysis of what it all means and how it fits together.