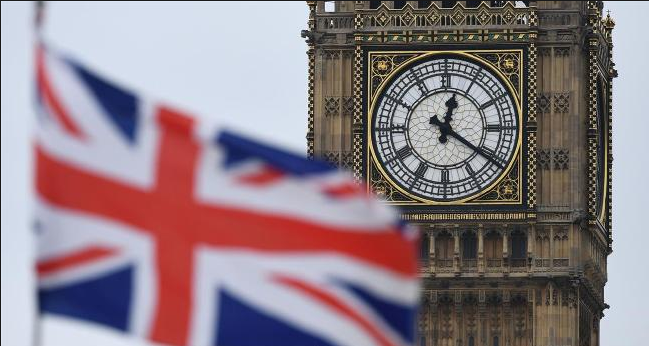
The U.K.
What most see in reaction to the UK political ruckus is the sharp drop in the pound, the .4% jump in the FTSE 100 and the rally in Gilts. Underneath though the domestically weighted FTSE 250 is lower by .50% and the small cap index is also down by .25% as we have the 5th largest economy that will dig deeper under an economic cloud. What is possibly most distressing for markets about the vote outcome is not just the difficulty Theresa May now has in governing, both Brexit and the country itself, it was the belief in the Labour leader Jeremy Corbyn and their party who might as well be Bernie Sanders’ twin brother in his thoughts. Here is how the Mirror in London described his manifesto: “Jeremy Corbyn vowed free childcare for ALL 2-4 year olds, a ‘fat cat tax’ on banks and football clubs that pay huge wages, a nationalized water industry and a new 45p tax threshold of 80,000 pounds a year. That was on top of measures already announced, from a plan to boost workers’ rights to renationalizing rail and mail.” Also, in the manifesto is a 50 percent tax on those earnings 123,000 pounds or more, a ‘Robin Hood Tax’ that would be added to each trade of stock, the corporate income tax rate would go up as would capital gains and the inheritance tax. Luckily he didn’t win the Prime Ministry but you get the point of what many were attracted to generally speaking. Populism rears its head again.
Industrial production in the UK in April was up by .2% m/o/m but that was well below the estimate of up .7%. Manufacturing was the key factor as it was also higher by .2% vs the .8% expected gain driven by a large drop in pharma. For the 3 months ended April, industrial production is lower by 1.2%. The resource sector and utility output saw outright declines in part due to weather. The UK economy is most vulnerable on the consumer side where citizens are feeling higher inflation at the same time wages are barely keeping up. Another round of pound weakness would of course just exacerbate that. The industrial side is doing better because of its export dependency. We can be sure that the BoE will remain extraordinarily easy. They are stuck in the corner of facing higher inflation which is their true mandate and their fear over what higher rates may do to a vulnerable economy.
Europe
French industrial production also was well below expectations in April as it fell .5% m/o/m vs the estimate of up .2% and was driven too by a sharper than expected drop in manufacturing led by a 6.3% plunge in auto’s. Bottom line, after a good Q1, the economic data out of Europe in April so far is more mixed.
German exports in April did grow by .9% m/o/m, triple the estimate and imports also were better than expected and grew faster than exports and thus led to a decline in its trade surplus to the joy of Peter Navarro and Wilbur Ross. Bottom line, Germany remains an export machine.
I still can’t get over how dovish Mario Draghi was yesterday but it’s becoming clear how fearful they are in unwinding their policy. I don’t see any other explanation.
The United States
While everyone obsesses about the direction of oil prices and its impact on the inflation stats, food prices quietly have been rising. At least in the US, the consumer price index has a higher weighting in food than energy. If you didn’t see, corn closed yesterday at the highest level in a year and the CRB food stuff index is at the highest level since August. This could be just a dead cat bounce but I repeat my bullish stance on the beaten up ag sector. See chart:
CRB FOOD STUFF

Yesterday we saw the Fed release its flow of funds statement and below is a chart thru Q4 (not updated yet for yesterday’s data) that reflects Net Worth as a percent of disposable income. It was 652% by December and as of Q1 2017 it is at 662%. You can see the two previous bubble peaks in Q1 2000 and Q4 2006. This chart reflects where the inflation has truly taken place via years of ZIRP and QE.
FRED Graph

China
Reflecting the reverse of the recent base effects, Chinese wholesale inflation moderated to a 5.5% y/o/y gain in May vs 6.4% in April and that was one tenth less than expected. This of course also coincides with the recent moderation in industrial material prices. CPI was up 1.5% y/o/y as expected with core CPI up 2.1% for a 2nd straight month. Bottom line, China’s economy clearly slowed further in Q2 as the juggle continues of trying to slow down excessive credit growth but trying to not impact economic activity too much. Chinese stocks were mixed as the Shanghai comp was up by .25% while the H share index was lower by .50%.
 Peter is the Chief Investment Officer at Bleakley Advisory Group and is a CNBC contributor. Each day The Boock Report provides summaries and commentary on the macro data and news that matter, with analysis of what it all means and how it fits together.