Positives:
- Initial jobless claims remained very low at 253k, 12k less than expected and little changed with last week’s print of 254k. This brings the 4 week average down to 258k from 259k last week and near a level seen 3 months ago. Delayed by a week, continuing claims fell by 25k after rising by 36k last week.
- The Markit’s index of US manufacturing for July was 52.9 up from 51.3 in June. It’s the best level since October. Markit said “July data signaled a further rebound in business conditions across the US manufacturing sector, led by a robust expansion of incoming new work and the fastest upturn in production volumes for 8 months. Job creation also strengthened in July, with the latest increase in payroll numbers the fastest seen over the past 12 months.” Export orders were softer implying that the improvement was all domestic. Markit concluded by saying “It remains too early to say if this is the start of a stronger upturn, but this is a welcome and encouraging sign of revival after the second quarter in which the PMI signaled the sector’s worst performance for over six years.”
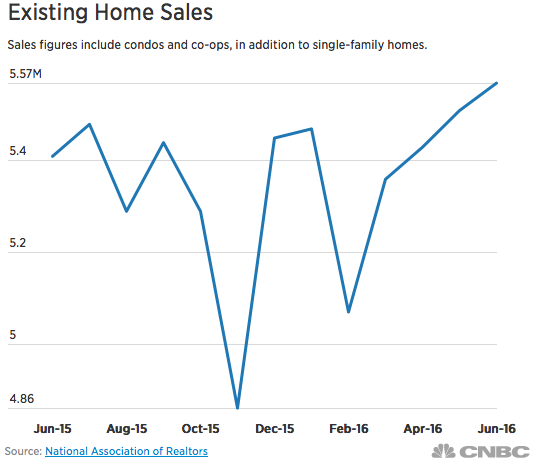
- Existing home sales in June totaled 5.57mm, almost 100k more than expected while May was revised down by 20k to 5.51mm. This is the highest level of sales since February ’07. Months’ supply remained modest at 4.6 months vs 4.7 in May. The median home price was up by 4.8% y/o/y to the most on record as higher priced homes dominated the mix. First time buyers made up 33% of sales which is the most in almost 4 years, up from 30% in May and 32% in April but still below the historical average of about 40%.
- June housing permits were about in line with expectations. Single family permits were up by 7k to 738k which is slightly above the average this year of 733k. Multi family permits totaled 415k, up 10k m/o/m and a touch above the 6 month average of 409k.
- The Eurozone services and manufacturing composite index saw only a modest fall to 52.9 from 53.1 in June and vs the estimate of 52.5. By .1 pts, it is the lowest since January ’15 with both components down m/o/m. “The eurozone economy showed surprising resilience in the face of the UK’s vote to leave the EU and another terrorist attack in France. The overall rate of economic growth is largely unchanged, suggesting GDP is growing at a sluggish but reasonably steady annual rate of around 1.5%.” Employment was a particular bright spot within the data.
- Prior to the UK referendum, the UK economy added a net 176k jobs for the 3 months ended May, well more than expectations of 73k and the unemployment rate fell to 4.9% from 5%. That is a new low in this cycle and touches the lowest level since September 2005.
- Taken after the UK referendum vote, French business confidence for July rose 2 pts to 102 to match the best level since 2011 and back to where it was in May. The long term average is 100 and was as high as 115 pre recession.
- The July Markit Japanese manufacturing PMI index rose to 49 from 48.1 but is still the 5th straight month below 50.
Negatives:
- The Philly index went negative to -2.9. That is below the estimate of +4.5 and down from +4.7 in June. The components however were in conflict with the headline number for the 2nd straight month with July for the better and June for the worse. The business activity 6 month outlook rose 4 pts but only after dropping by 6 pts in June.
- With the 20 bps jump in the 10 yr note yield last week, there was a 5 bps increase in the average 30 yr mortgage rate to 3.65% off last week’s 3 yr low. After spiking in the two prior weeks, refi applications fell .9% w/o/w but are still up 105% y/o/y. Purchase applications fell 2% but remain up almost 16% y/o/y.
- Housing starts in June totaled 1.189mm which was 24k more than expected but May was revised down by 29k and April was lower by 12k so let’s call it a miss. For single family, starts were 778k from 745k in May which was revised down by 19k. That 778k figure is about in line with the 6 month average of 776k but remains well below the 25 yr average of about 1mm. Multi family starts totaled 411k, the most since September which compares with the 6 month average of 379k.
- The UK services and manufacturing composite index fell to 47.7, the weakest level since early 2009 from 52.4 in June. “Output and new orders both fell for the first time since the end of 2012, while service providers’ optimism about the coming 12 months slumped to a 7 ½ yr low…A number of firms linked this to ongoing uncertainty pre and post EU referendum, with reports especially prevalent among service providers.”
- Mostly conducted pre vote (survey done between May 29th and July 2nd), UK retail sales in June ex auto fuels fell .9% m/o/m, a bit more than the estimate of down .6% after a .9% gain in May. The y/o/y gain slowed to 3.9% from 5.2% in May.
- UK jobless claims in June rose .4k, below the estimate of an increase of 3.5k but May was revised much higher, by 12.6k.
- Even before the impact from the sharp decline in the pound at the end of June starts to show up in the data, headline consumer price inflation in the UK rose .5% y/o/y and the core rate was higher by 1.4%, both one tenth more than expected. The core rate was just one tenth from matching the highest level since August 2014 as services inflation was higher by 2.8% y/o/y.
- The ZEW July index fell from +19.2 to -6.8 which was well below the estimate of +9.0 and the worst print since November 2012. The Current Situation fell to 49.8 from 54.5. That is the 2nd lowest read since early 2015. The ZEW President said “The Brexit vote has surprised the majority of financial market experts. Uncertainty about the vote’s consequences for the German economy is largely responsible for the substantial decline in economic sentiment. In particular, concerns about the export prospects and the stability of the European banking and financial system are likely to be a burden on the economic outlook.” For the Eurozone as a whole, Economic Sentiment fell to -14.7, the weakest since August 2012 from +20.2 last month.
- The number of price gains in 70 China cities surveyed moderated on a m/o/m basis. For new apartments, prices rose in 55 cities in June vs 60 in May and 65 in April. In December there 39 cities that saw price increases. For existing apartments prices rose in 48 cities, down 1 from May and down 3 from April. In December it was at 37. On a y/o/y basis for both new and existing apartments however, prices grew in even more cities than the month prior. Price gains are still out of control in the major cities with Shenzhen seeing a 47% y/o/y increase but that is actually down from 53% in May. Prices in Shanghai were up 28% vs last year, the same pace as the prior month and they were higher by 20% in Beijing.
 Peter is the Chief Investment Officer at Bleakley Advisory Group and is a CNBC contributor. Each day The Boock Report provides summaries and commentary on the macro data and news that matter, with analysis of what it all means and how it fits together.