• Skip to main content
  • Skip to primary sidebar
  • Skip to footer

The Boock Report

  • Home
  • Free Content
  • Login
  • Subscribe

May 31, 2023 By Peter Boockvar

Another negative print/Job openings lift but quit rate at 2+ yr low

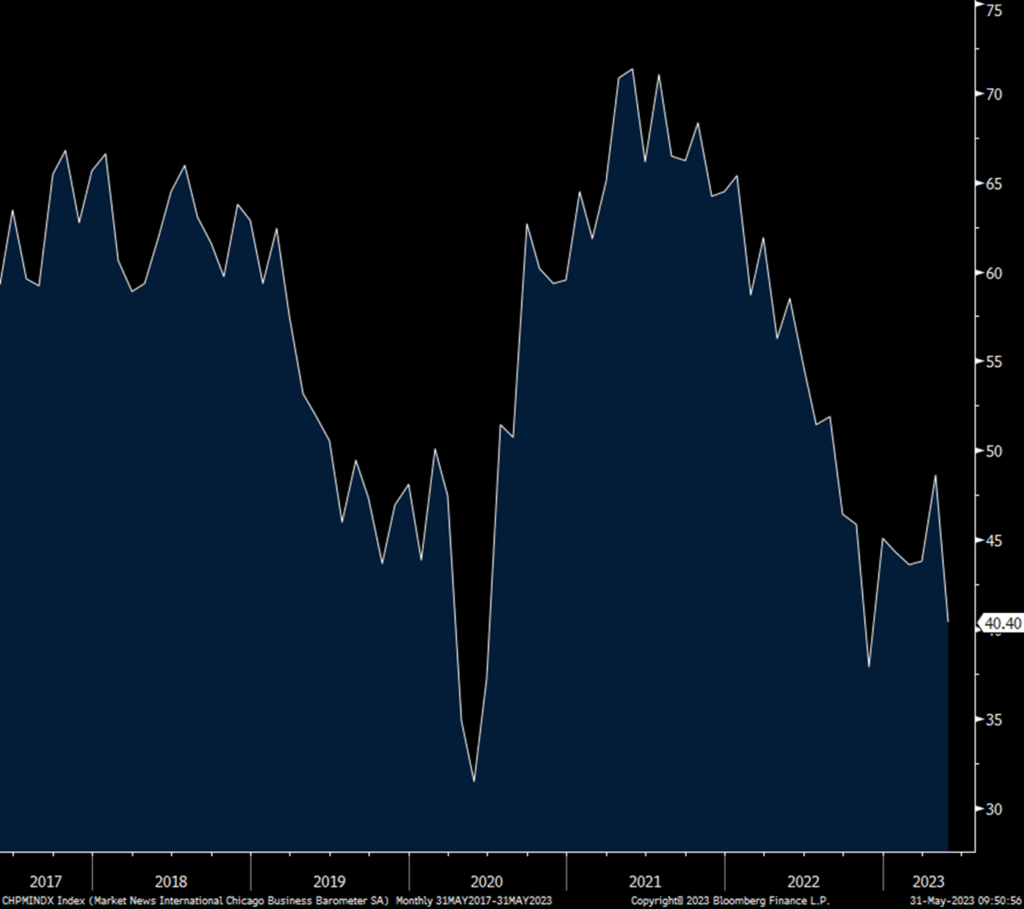
After yesterday’s deeply negative Dallas manufacturing survey which followed negative prints from NY, Philly, KC and Richmond, today’s Chicago May figure fell to 40.4 from 48.6, thus well under the breakeven of 50. As I don’t have the press release yet I have no details on the internals. Expect another below 50 print in tomorrow’s ISM manufacturing index and which if the case would be the 7th straight month.

Chicago PMI
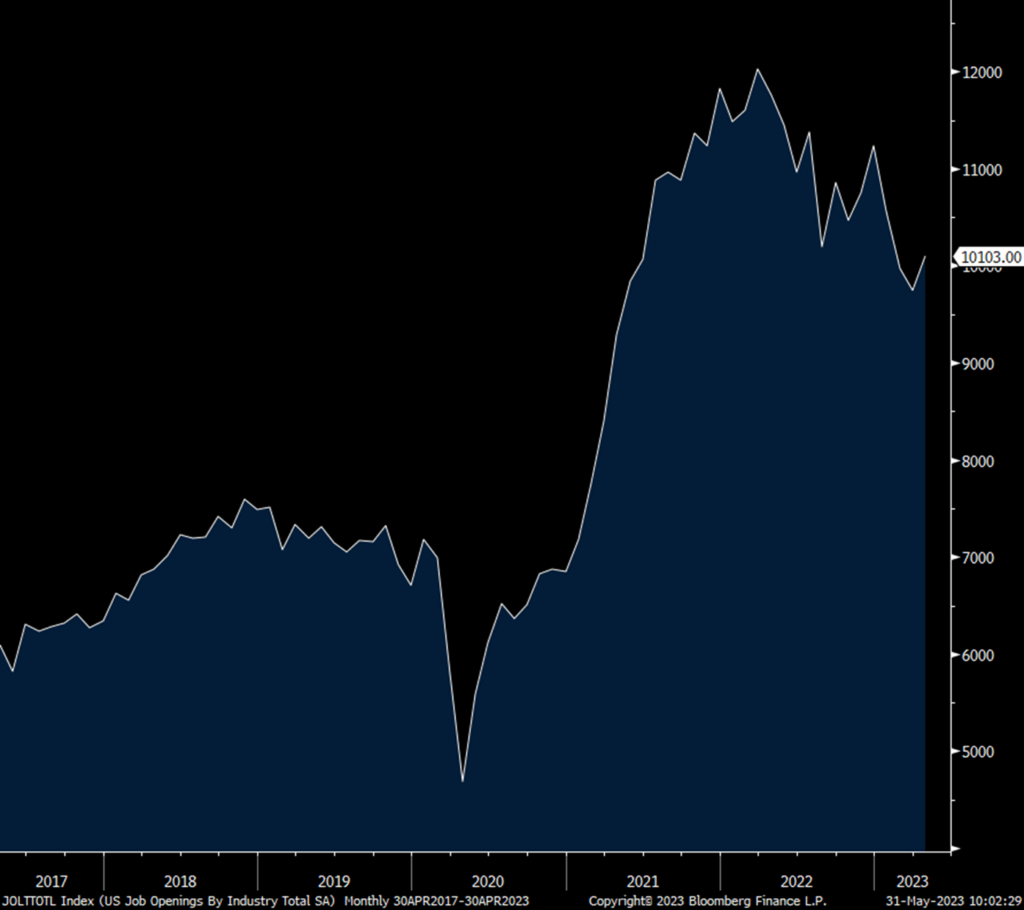
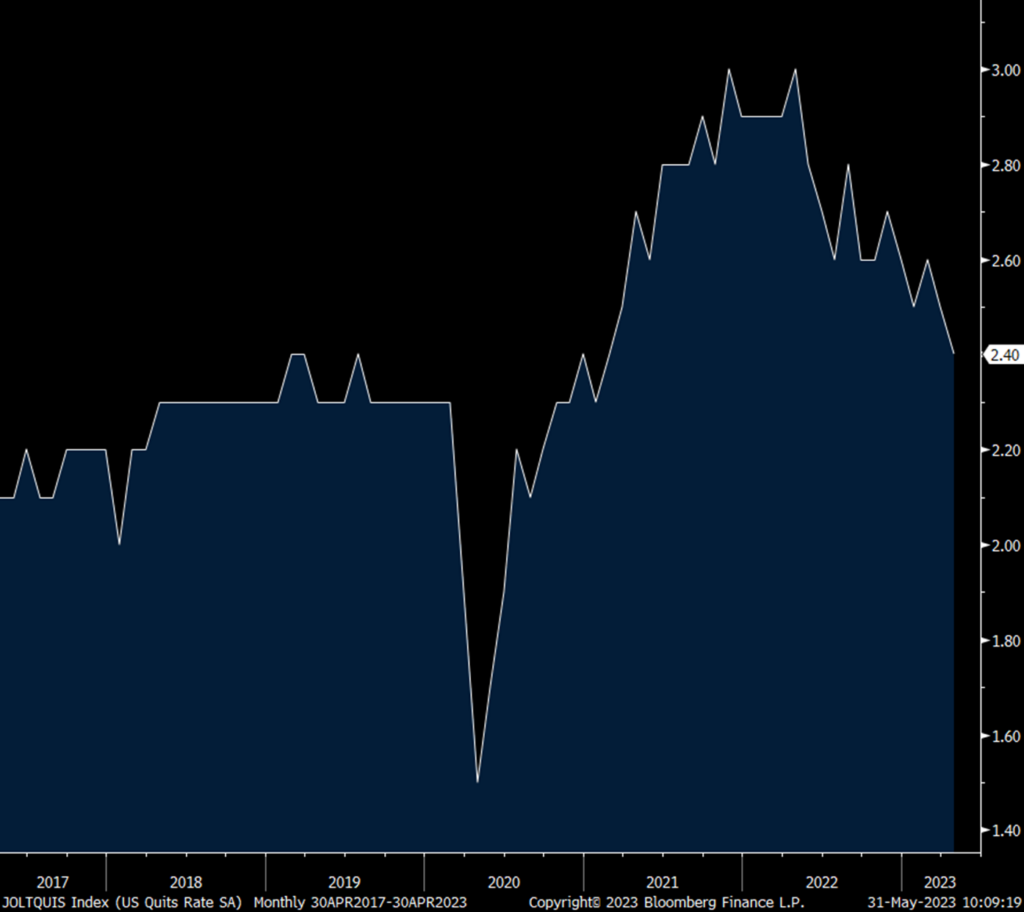
Job openings in April rose to 10.1mm and that’s up from 9.75mm in March (revised up from just under 9.6mm). The hiring rate though remained unchanged at 3.9% and noteworthy, the quit rate fell to 2.4% from 2.5% and that is the lowest since January 2021.

After falling in March, job openings picked up in construction (likely more demand from some of the big builders). Manufacturing job openings did fall to the lowest since February 2021. There was a jump in demand for retail workers and in transportation but openings for leisure/hospitality, which was the big demand spot over the past few yrs post Covid, continues to shrink as they fell to the lowest since April 2021. Not surprisingly job openings for real estate/rental/leasing fell but did rise for finance/insurance. Demand for education/healthcare workers remains consistent.

Bottom line, I know this is a big focus of everyone but it’s very dated and the trend is still for a lesser amount of openings as this April figure compares with the 2022 average of 11.17mm. Yields did rise in response to the upside surprise. Friday’s estimate for the May BLS payroll report, and thus more timely, is for a job gain of 195k which would be the 2nd month in 3 below 200k which was last seen in late 2019 pre Covid.

The economic outlook is pretty damn cloudy with a huge amount of confusion on what happens from here but if I had a dollar for every time I heard ‘challenging macro economic environment’ from companies in their quarterly calls I’d be able to buy a sports team. Point here is the Fed should show some humility too in not being so confident on how things play out in the coming months and if the case would mean a time out on rate hikes until we can gain some clarity. After all, there is another meeting in July, and in September, and yes in November and December too if they choose to keep on hiking. I’m not telling them to back off from their inflation goals but skipping a meeting doesn’t mean they have to.

Job Openings
Quit Rate
END

May 31, 2023 By Peter Boockvar

China/Europe/US mfr’g/Reality checks on tech

The economic data out of China seems to be the main driver of stock, bond, FX and commodity markets today. It’s state sector focused manufacturing PMI fell to 48.8 from 49.2 and vs the estimate of 49.5. The service piece was down 1.9 pts to 54.5 which was below the estimate of 55.2. A few things here. The manufacturing weakness is as much a reflection of the global economic slowdown in trade than it is about China. US and European manufacturing are in a recession too. The service PMI includes construction and we know China’s residential real estate market is still under pressure, though has stabilized for now. Chinese strength is still being seen in leisure, hospitality, and travel. I don’t think much of the above should be so surprising but the market response today makes it seem to be. 

The Shanghai comp was lower by .6% and the H share index by 1.9%. Also, all of Asia was red overnight and the yuan is weaker. Oil is down again, copper is weaker by .5% for a 2nd day but iron ore is little changed. European stocks are down too with some having China as their biggest customer.

The other thing of note today was the lower than expected May inflation stats from France which followed the Spain print yesterday that was too. We’ll see Germany’s at 8am. France saw headline CPI fall by one tenth m/o/m vs the forecast of up .3%. Versus last year it slowed to 6% from 6.9%. A drop in energy prices and slower rate of gain in food were the main reasons. All was not ok though with European inflation as Italy said its May CPI rose .3% m/o/m, well above the estimate of down .2%. It was up 8.1% y/o/y, 6 tenths above the forecast, though down from 8.7% in April. The 5 yr 5 yr euro inflation swap is down 3 bps and lower by 7 bps this week to 2.50% but that comes after rising by 12 bps last week. As seen below it remains near the highs. European bonds are rallying with yields lower and that in turn is helping US Treasuries to rally for a 2nd day after last week’s weakness.

5 yr 5 yr Euro Inflation Swap

Speaking of US manufacturing, the Dallas regional survey seen yesterday fell to -29.1 from -23.4 and that marks the 13th month in a row under zero. Here were some important comments:

Chemical Mfr’g

“Volumes have not rebounded at a level we would expect this time of year. Orders seem to be erratic, which is in line with automotive and building construction markets trending downward as interest rates have deeply impacted both of these key, basic materials consumer sectors.” 

Food Mfr’g

“Order volume has stalled recently.”

“We have different dynamics and drivers in our business. We clearly are moving into a period of stagflation.”

Machinery Mfr’g

“We are seeing a massive slowdown in business activity.” 

Paper Mfr’g

“We are seeing all indications of a continued slide in demand (three quarter now). Prices are coming down some, but labor costs are still going up. This offsets any reduction in material costs, so margins are down as a result.” 

Primary Metal Mfr’g

“Business is slowing down. That is certain.” 

“The building and construction industry remains significantly off, primarily residential.”

Textile Product Mills

“We feel better now than we did a month ago about sales and the general environment.” Remember Costco talked about good apparel sales as did Abercrombie and American Eagle. 

Transportation Equipment Mfr’g

“There is nothing encouraging on the horizon.”

While tech investors are caught up in their hopes and promise for the new iteration of AI, the tech earnings last night were a reality check. 

From HPQ:

“As expected, the industry wide headwinds we described last quarter continue to impact our business…Looking first at the market level, global economic uncertainty remains elevated. The macro environment is challenging across most geographies. We continue to see cautious consumer discretionary spending while enterprises are delaying capital investments.”

“We continue to make solid progress on reducing our channel inventory levels sequentially, but levels remain slightly elevated for us and across the industry. As a result, we continue to see aggressive pricing in the quarter.”

And of course the AI commentary, “Looking ahead, we see potentially significant and incremental opportunities to leverage AI and generative AI to positively impact both our products and solutions and how we operate.”

From HPE:

“In the 2nd quarter, we saw some decline in the health of microeconomic conditions, causing unevenness in customer demand, particularly in general purpose compute. We also see unevenness when comparing customer size, industry or geography. European, Asian and mid size company deals are holding up better than expected, while large enterprise businesses and customers in certain sectors, such as financial services and manufacturing in North America, have been more conservative with their spend.” I’d guess ‘financial services’ weakness is mostly from the US banks. 

More from HPE, “In the last few months, sales cycles have elongated, because customers are more reluctant to quickly commit to large projects or some will seek additional internal approvals at the time of their order.”

Box also talked about greater scrutiny of larger deals and “We did want to call out kind of an incremental element of softness on the SMB (small and medium sized businesses) front in the US.”

From Ambarella which is down almost 20% pre market:

“Our Q1 result was slightly ahead of our expectations, despite the significant headwinds from the ongoing semiconductor industry cyclical downturn.” This was followed by AI, AI, and more AI commentary. 

On their fiscal yr 2024 outlook, “Customer feedback on end demand remains generally healthy. However, at the same time, customers also continue to aggressively manage down their inventory levels. Considering these factors, we estimate that our fiscal Q2 revenue will be flat to Q1…By end market, we expect that both automotive and IoT revenue will be approximately flat sequentially as well.”

END

May 30, 2023 By Peter Boockvar

Home prices/Mixed info in consumer confidence data

Home prices in March, thus somewhat dated and reflecting just the beginning of the important spring transaction season, rose .66% y/o/y following a 2.1% rise in February according to S&P CoreLogic. The comparisons were very tough as prices rose 21% in March 2022 which came after rising by 13.5% in March 2021. One has to go back to 2012 to see the last time home prices were little changed and which of course followed the sharp drop. From a m/o/m standpoint, home prices rose for a 2nd month by .4% and follows a string of declines. To this, S&P said “Two months of increasing prices do not a definitive recovery make, but March’s results suggest that the decline in home prices that began in June 2022 may have come to an end. That said, the challenges posed by current mortgage rates and the continuing possibility of economic weakness are likely to remain a headwind for housing prices for at least the next several months.”

The cities with the quickest pace of gains continues to be in the sunbelt, Miami, Tampa, Charlotte and Atlanta. The laggards were seen in Seattle, San Francisco, San Diego and Las Vegas.

Bottom line, we know all about the supply constraints with existing homes as high mortgage rates currently have trapped, so to speak, those with much lower mortgage rates in their home. Home construction is certainly trying to fill in that gap as total transactions of about 30% are now filled in by builders vs the historical average is something closer to 10%. This only works though in some markets where land and lots are readily available. In highly dense suburban markets one has to go far out from city centers in order to find communities of new construction. The end result is still an overall subdued pace of housing transactions, though prices remain still high. I guess we can call it a stagflationary situation in at least this sector of the economy.

Home Price Index y/o/y

The Conference Board’s May consumer confidence index was 102.3 and while that was 3 pts above the estimate, it’s down from 103.7 in April which was revised up by 2.4 pts. This compares with 104 in March, 103.4 in February and 106 in January. Both the Present Situation and Expectations components were lower m/o/m. One yr inflation expectations fell one tenth to 6.1% and that is the smallest since December 2020. That compares with 5% in the 20 yrs leading into Covid.

The answers to the labor market questions softened. Those that said jobs are Plentiful fell to the lowest since April 2021 and those that said they are Hard to Get rose to a 6 month high. Also, those that see ‘more jobs’ in the coming 6 months fell to the least since May 2016. Income expectations though did rise .5 pt.

With regards to spending intentions, after falling by 1 pt last month, plans to buy a vehicle rose .9 pts. Plans to buy a home was little changed. Plans to buy a major appliance did bounce by almost 4 pts.

In terms of the age and income distribution, the Conference Board said “While consumer confidence has fallen across all age and income categories over the past three months, May’s decline reflects a particularly notable worsening in the outlook among consumers over 55 yrs of age.”

Bottom line, the weakness in the current jobs situation and expected employment weakness was the notable take. Spending intentions though held in as inflation expectations receded again.

Consumer Confidence

One yr Inflation Expectations

Those that see ‘more jobs’

END

May 30, 2023 By Peter Boockvar

Post deal things to think about

Assuming Congress now passes what was agreed upon we now get to test the thesis of a liquidity sucking sound out of private sector assets to fund the refill of the Treasury’s coffers and whether it matters or not. The complexion of the buyers will be important too. To buy many of the T-bills, will the money come out of the Fed’s RRP or will bank reserves get drained or will fresh money into money markets handle some of the weight? Also, while the government spending line will be pretty much set for the next few years, the tax revenue side is definitely not. Treasuries are rallying today on the deal, particularly the short term bills that many avoided on the deal date uncertainty. After this pricing reset, especially for the bills that were maturing between June 1 and the 15th, we’ll see how the market handles the supply. 

Also to think about, what happens to economic activity as the government’s base line spending is supposed to grow at a much slower pace than that seen over the past 3 years? My friend Luke Gromen in his weekend piece made a great point, “with Federal spending at around 25% of GDP, deficit cuts would likely drive tax receipts down and deficits higher.” The budget deficit as a % of GDP already stands at around 7%. In recessions going back 40 years, it bottomed at 5-10% at the depths of the respective recession whereas now we’re only dancing with the prospect of one. In the upcoming recession, we’ll see this most likely in double digits. 

Specifically with spending, my friend David Rosenberg yesterday pointed out that beginning student debt loan payments will be a cost to the borrower in the aggregate of $5b per month starting soon. Also, the end of the emergency SNAP (Supplemental Nutrition Assistance Program) benefits was about a $50b per year economic stimulus that is expiring. Now there are some offsets like the $5 trillion plus that is in money market funds getting a yield of about 4% which equates to about $200b of newfound income on an annualized basis. About 14 months ago this money which totaled about $4.5 trillion was yielding nothing as we know. But, the differentiation of who is benefiting and who is going to be negatively impacted by the above are certainly not necessarily the same. 

In the bank loan data from Friday, C&I loans outstanding rose $1b after falling by $15b in the prior 4 weeks. This slight lift comes off the smallest amount since last October. Bank deposits rebounded by $30b after the drop of $26b last week. It’s uncertain as to how much went into high yield deposits and/or CDs that banks are employing to a greater extent in order to stem the deposit losses. Either way, it’s good to see the rise in deposits but it comes at a big cost to banks relative to the near zero cost of funds they are still offering many. 

There was some inflationary relief in Spain as they said its CPI fell .2% in May m/o/m instead of rising by 2 tenths that was expected. The y/o/y gain slowed to 2.9% from 3.8%. The prices of food and energy continued to moderate. Core CPI slowed too but still remains high at 6.1%. Yesterday the Governor of the Spanish central bank said “We think that we still have some way to go in tightening monetary policy, although we also think that we are closer to the end.” 

There was notable softness in the May Economic Confidence index for the Eurozone as this index fell to 96.5 from 99 and that was 2.3 pts below expectations. That’s also a 6 month low. Manufacturing, services, retail and construction components all weakened while consumer confidence was little changed but at the best level since February 2022. On the this, the Spanish CPI figure and the US Treasury rally has European bonds rallying too with yields lower. 

Eurozone Economic Confidence 

With the reelection of Erdogan in Turkey again as the president, the Turkish lira is falling for the 15th day in the past 16 and by 1.4% today after the drop of .7% yesterday. I’d call it a form of sado masochism on the part of the majority of the Turkish voters that wanted him again as president considering the destruction in the standard of living that Erdogan’s policies have brought. The Turkish lira is down 90% vs the US dollar since Erdogan took power. 

Speaking of FX, with the Japanese yen weakening to the 140 level vs the US dollar, a government currency official in Japan said “It’s important that currency markets reflect fundamentals and move in a stable manner. Excessive moves aren’t desirable.” So it seems that 140 level is their soft line in the sand and the yen is rallying in response to back under 140. 

Yen

May 26, 2023 By Peter Boockvar

Succinct Summation of the Week’s Events

Succinct Summation of the Week’s Events:

Positives,

1)Initial jobless claims totaled 229k vs the estimate of 245k and last week was revised down by a sharp 17k to 225k. Maybe this is normalizing the fraudulent reports from Massachusetts and Kentucky from a few weeks ago. The 4 week average held at 232k. Continuing claims fell by 5k to 1.794mm but not far from the highest since December 2021.

2)The S&P Global services PMI in May improved further to 55.1 from 53.6 with particular strength in travel and leisure.

3)Personal income growth of .4% m/o/m was as forecasted. Specifically private sector wages and salaries grew by .5% m/o/m and 5.6% y/o/y (vs 5.3% in the month prior and 5.6% in the month before that). Spending was up .8%, 3 tenths more than estimated with a rebound in spending on both durable and non-durable goods. Spending on services continues on. Combining the two saw the savings rate fall to 4.1% from 4.5% and for perspective, this has averaged 6% in the 20 years leading into Covid.

4)Core durable goods orders in April were much better than anticipated with a 1.4% m/o/m jump vs the estimate of no change but comes after a .6% drop in March and .2% fall in February. The internals though driving the gain was pretty mixed.

5)New home sales were about as expected when we include the March downward revision. Smoothing out the monthly volatility has the 3 month average at 657k vs the 6 month average of 640k and the 12 month average of 613k.

6)The final May UoM consumer confidence index was 59.2 vs the initial print of 57.7 but still down from 63.5 in April and the lowest since last November. One yr inflation expectations fell 4 tenths m/o/m to 4.2% while the 5-10 yr outlook was up one tenth to 3%. In particular, “Consumer confidence in the government’s handling of the economy fell substantially this month, reflecting the government’s failure thus far to resolve the debt ceiling crisis.”

7)Nvida’s blowout guidance highlights the excitement and rush to create and capture the benefits of the new iteration of AI.

8)A positive on retail, DICKS Sporting Goods in their earnings call said people are still spending on athletic stuff. “We had really strong transaction growth…We had ticket growth. We have more athletes purchasing from us, purchasing more frequently, and spending more per trip. And I think very importantly, you have to look at each of our income demographics and we saw growth across every single income demographic from a lower income consumer to an upper income consumer. We did not see trade down from best to better or better to good. Overall, we really feel very good about how our consumer is holding up.”

9)UK retail sales in April ex auto fuel rose .8%, 4 tenths more than expected but March was revised down by a like amount so call it a push relative to expectations.

10)Japan’s composite May PMI improved by 2 pts m/o/m to 54.9 with services rising to 56.3 from 55.4 and manufacturing getting back above 50 at 50.8 from 49.5. That composite figure is the best since 2013. S&P Global said “Service providers continued to report strong growth momentum with a renewed record increase in business activity, while manufacturers indicated an improvement in operating conditions for the first time in 7 months, with output and new orders returning to expansion territory for the first time since last June. Firms were also optimistic about the outlook for activity in the near and medium term.”

11)The Bank of Korea and the Indonesian central bank both kept rates unchanged as expected. While the Reserve Bank of New Zealand raised again they also said that they are now done.

12)It’s not just AI that’s helping the economy right now, Swifties are too, //www.youtube.com/shorts/q03Y9q_Vt08

Negatives,

1)Highlighting the embarrassment of the debt negotiations, Fitch puts the credit rating of the US government on credit watch negative.

2)Headline PCE for April rose .4% m/o/m as did the core rate and both were one tenth above expectations. The y/o/y gains were 4.4% and 4.7% respectively, up from 4.2% and 4.6% in the month prior. Goods prices were up 2.1% y/o/y and service prices grew by 5.5% y/o/y.

3)The May S&P Global US manufacturing PMI fell back below 50 at 48.5 vs 50.2 in April. It’s now in contraction for the 6th month in the past 7.

4)April pending home sales was flat m/o/m vs the estimate of up 1% and follows a 5.2% drop in March. There was an outsized drop in sales in the Northeast which dropped 11.3% m/o/m after an 8.1% fall in March. Sales in the south were flat and rose out West and in the Midwest. To this the NAR said “Minor monthly variations in regional activity are typical. However, cumulative results over many years clearly point towards a much greater number of home sales in the South.” The NAR also said “Not all buying interests are being completed due to limited inventory. Affordability challenges certainly remain and continue to hold back contract signings, but a sizeable increase in housing inventory will be critical to get more Americans moving.”

5)The MBA said the purchase applications for the week ended May 19th fell 4.3% w/o/w and by 30% y/o/y. This component is now at the lowest since early March and near the lowest going back to 1995. Refi’s fell 5.4% w/o/w and are down by 44% y/o/y.

6)The April goods trade deficit jumped to $96.8b, $11b more than expected and helped to drive a drop in the Atlanta Fed’s Q2 GDP forecast to 1.9% from 2.9%.

7)The May Philly non-manufacturing PMI was -16, below zero for the 3rd straight month.

8)Some other noteworthy retail earnings comments,

COST: “Our average daily transaction or ticket was down 4.2% worldwide and down 3.5% in the US, impacted in large part from weakness in bigger ticket non-foods discretionary items.”

DLTR: “the consumer continues to be under pressure. There are simply fewer dollars available to them and those dollars are not going as far as they did a year or two ago. We are past the multiple rounds of government stimulus, SNAP dollars have been reduced and tax refunds are running lower. These impacts combined with persistent inflation have more families prioritizing needs over wants.”

RH: “With 30 yr mortgage rates trending at 20 yr highs, the possibility of continued economic tightening required to tame inflation, and uncertainty regarding the recent regional banking crisis, we expect luxury housing markets and broader economy to remain challenging throughout fiscal ’23 and into next year.”

WOOF: “we saw a more cautious consumer beginning in the 2nd half of the first quarter, resulting from banking uncertainty and lower tax refunds, which continues to weigh on discretionary spend.”

LOW: “we are updating our full-year outlook to reflect softer than expected consumer demand for discretionary purchases.”

9)The American Trucking Association’s said its For Hire Truck Tonnage index fell 1.7% in April after dropping by 2.8% in March and they said “While the broader economy continues to surprise and thus far stave off an expected recession, the freight economy is starkly different. The goods-portion of the economy is soft and as a result, even contract truck freight is now falling, albeit not nearly as much as the spot market. The tonnage index hit the lowest level since September 2021 in April and has now fallen on a y/o/y basis for two straight months.”

10)The April US Architecture Billings Index fell to 48.5 vs 50.4 in March. Particular weakness was seen in ‘multifamily residential’ whose component fell to 41.5 from 44.2 and thus well below 50. AIA chief economist said “The ongoing weakness in design activity at architecture firms reflects clients’ concerns regarding the economic outlook. High construction costs, extended project schedules, elevated interest rates, and growing difficulty in obtaining financing are all weighing on the construction market.”

11)The May Richmond manufacturing index joins NY and Philly in seeing contraction, again. Its index fell to -15 from -10 and that was double the estimate. The Richmond Fed said simply, “manufacturing firms reported deterioration in business conditions in May.”

12)In last Friday’s loan data, C&I loans outstanding for week ended 5/10 fell for a 4th straight week by $3.5b and taking it to the least since last October. Bank deposits declined by another $26.4b to the lowest amount since last July.

13)Australia’s composite services and manufacturing PMI for May fell to 51.2 from 53 as manufacturing was unchanged at 48 and services slipped by almost 2 pts to 51.8. S&P Global referred to the m/o/m drop as “a small retracement from the strong April outcome reinforcing the view that overall economic activity in Australia is holding up well as we enter the winter months.” That said, “The recent strength in services results stands in contrast to manufacturing.”

14)Tokyo said its May core/core inflation rose 3.9% y/o/y as expected and up one tenth from April. Governor Ueda has remained still very dovish saying “We haven’t reached Japan’s inflation target sustainably and stably.”

15)Taiwan’s exports in April fell 18.1% y/o/y, worse than the forecast of down 13.8%. A drop in electronic products led the way. As for the first 20 days in May, South Korea said its exports dropped by 16% y/o/y also driven by a slowdown in semi exports which were down by 36% y/o/y. The positive was the jump in shipments of autos which were up 55% y/o/y as inventories continue to be reset.

16)The May Eurozone PMI was mixed as manufacturing continued to soften to 44.6 from 45.8. Services remained strong but a bit less so at 55.9 vs 56.2 in April. Combining the two saw their composite index fall to 53.3 from 54.1. S&P Global said “The resulting outperformance of services relative to manufacturing was the widest since January 2009.” Germany’s manufacturing PMI fell all the way down to 42.9 from 44.5 while France is at 46.1 vs 45.6 in April.

17)The same story was seen in the UK with its manufacturing PMI falling to 46.9 from 47.8 while services came in at 55.1, though down .8 pts m/o/m. The composite index was 53.9 vs 54.9 in April “with the expansion continuing to be driven by surging post-pandemic demand in the service sector, notably from consumers and for financial services, with hospitality activities buoyed further by the Coronation.” Service prices in turn are remaining high. In contrast with manufacturing, “many companies are winding down their inventories, exacerbating the downturn in demand and driving both output and prices lower.” The net result, same as in the Eurozone, “The UK is seeing a tale of two economies.”

18)The May German IFO business confidence index softened to 91.7 from 93.4 and that was below the forecast of 93. Most of the decline came from the Expectations component but the Current Assessment was down too m/o/m. The IFO said “Managers are somewhat less satisfied with their current situation. German companies are skeptical about the upcoming summer.”

19)French business confidence dropped as well with its index down 2 pts to the lowest since April 2021.

20)April UK CPI rose 8.7% y/o/y. While down from the 10.1% pace seen in March it still was 5 tenths more than expected and the core rate accelerated further to 6.8% from 6.2%. The estimate was for no change. PPI moderated more than expected.

END

May 26, 2023 By Peter Boockvar

Inflation stats, along with income, spending, savings rate and cap ex

Headline PCE for April rose .4% m/o/m as did the core rate and both were one tenth above expectations. The y/o/y gains were 4.4% and 4.7% respectively, up from 4.2% and 4.6% in the month prior. Goods prices were up 2.1% y/o/y and seems to have bottomed out and service prices grew by 5.5% y/o/y and likely has topped out as rent growth recedes from here.

Bottom line, because PCE comes out weeks after CPI there is typically less drama and thus rarely deviates much from expectations. Even though the numbers came in a bit above estimates, I don’t believe any Fed member should be making their June meeting decision solely on the basis of a one tenth upside of a backward looking figure. Yes, inflation is persistent, though at a slowing pace and the rental growth slowdown is not yet reflected. There must be some appreciation that since SVB failed, between the Fed and credit conditions, we’ve seen an additional 100 bps of rate increase equivalents (give or take). Isn’t it just prudent to see how things play out in the coming months? Isn’t there another FOMC meeting in July and usually every 6 weeks thereafter?

Headline PCE y/o/y

Personal income growth of .4% m/o/m was as forecasted. Specifically private sector wages and salaries grew by .5% m/o/m and 5.6% y/o/y (vs 5.3% in the month prior and 5.6% in the month before that). Spending was up .8%, 3 tenths more than estimated with a rebound in spending on both durable and non-durable goods. Spending on services continues on. Combining the two saw the savings rate fall to 4.1% from 4.5% and for perspective, this has averaged 6% in the 20 years leading into Covid. We might see a slight raise in Q2 GDP estimates on that upside in spending. We’ve heard so much information from many retailers over the past few weeks that tells us all we need to know about the state of consumer spending.

Core durable goods orders in April were much better than anticipated with a 1.4% m/o/m jump vs the estimate of no change but comes after a .6% drop in March and .2% fall in February. The internals though driving the gain was pretty mixed. Orders for vehicles/parts fell for a 2nd month and hasn’t grown since January. All those chip orders for AI hasn’t yet showed up as orders for computers/electronics and electrical equipment both declined m/o/m. Machinery orders were the only upside, gaining 1% but after drops in 4 of the previous 5 months. Metals orders were mixed.

Shipments of core goods were about as expected when we include the March downward revision so there shouldn’t be any GDP change on this.

Bottom line, while that core figure saw nice upside, the breadth of gain was pretty limited and I’ll say again, a company needs growing cash flow in order to finance growth in capital spending and for many companies, the trajectory of earnings and cash flow is now down.

  • « Previous Page
  • Page 1
  • Page 2
  • Page 3
  • Page 4
  • Page 5
  • …
  • Page 653
  • Next Page »

Primary Sidebar

Recent

  • July 1, 2023 The Boock Report is now On Substack
  • June 6, 2023 Travel remains strong and the credit crunch is on
  • Subscribe
  • Free Content
  • Login
  • Ask Peter

Categories

  • Central Banks
  • Free Access
  • Latest Data
  • Podcasts
  • Uncategorized
  • Weekly Summary

Footer

Search

Follow Peter

  • Facebook
  • LinkedIn
  • Twitter

Subscribe

About Peter

Peter is the Chief Investment Officer at Bleakley Advisory Group and is a CNBC contributor. Each day The Boock Report provides summaries and commentary on the macro data and news that matter, with analysis of what it all means and how it fits together.

Read More

Disclaimer - Peter Boockvar is an independent economist and market strategist. The Boock Report is independently produced by Peter Boockvar. Peter Boockvar is also the Chief Investment Officer of Bleakley Financial Group, LLC a Registered Investment Adviser. The Boock Report and Bleakley Financial Group, LLC are separate entities. Content contained in The Boock Report newsletters should not be construed as investment advice offered by Bleakley Financial Group, LLC or Peter Boockvar. This market commentary is for informational purposes only and is not meant to constitute a recommendation of any particular investment, security, portfolio of securities, transaction or investment strategy. The views expressed in this commentary should not be taken as advice to buy, sell or hold any security. To the extent any of the content published as part of this commentary may be deemed to be investment advice, such information is impersonal and not tailored to the investment needs of any specific person. No chart, graph, or other figure provided should be used to determine which securities to buy or sell. Consult your advisor about what is best for you.

Copyright © 2025 · The Boock Report · The Ticker District Network, LLC

  • Login
  • Free Content
  • TERMS OF SERVICE