Use this link to sign up and access all the The Boock Report has to offer.
Use this link to sign up and access all the The Boock Report has to offer.
Over the past two days on CNBC we’ve heard from the CEO’s of Marriott, Hyatt, Hilton and Loews. The tone was very positive from all, particularly with regards to leisure travel. The Marriott CEO yesterday on Squawk Box said “if there are any questions about the resilience of travel, those have been answered over the last couple of years…It’s across every segment and every part of the world.” He did say though specifically with luxury that the strong rate trends of 2022 have moderated a bit this year. The Hyatt CEO this morning said that leisure travel is trending about 30% above 2019 levels, that group travel is looking good for the summer but business travel, while still improving, is more uncertain as it trends still below 2019 levels. He said that small and medium sized business employees are back on the road more so than those from large companies.
Sara Eisen interviewed the CEO of Hilton Chris Nassetta also yesterday and who said he’s “not so far” seeing any signs of a travel slowdown. He said leisure, business (also being led by small and medium sized business employees he said and where revenue is just above 2019 levels) and meetings/events (pent up demand with planning seen for 2024 and 2025) are all strong notwithstanding signs of slowing economic growth he pointed out. He was optimistic about international travel which is still lagging the recovery (inbound to the US just 60% of pre-Covid levels), particularly out of China (outbound is just 10% of pre-Covid).
Nassetta also pointed out something really important and something I coincidentally read about yesterday from Reuters but having been watching for signs of this post SVB. He mentioned the lack of development that will limit the amount of supply of hotels in the coming years. Here was the title of the article from Reuters, “US Hotel Developers Run Out of Cash as Construction Lending Dries Up.” The article said “Hotel developers, private equity firms, and general contractors told Reuters the financial stress on regional banks – the largest lenders to hotels and other CRE markets – has forced developers to postpone projects or find other creative ways to raise capital.”
The piece highlighted that post SVB’s failure a California developer paused construction on a 21 story hotel and casino in Vegas as they were trying to “secure more funding.” Notably, “Since March, 59 of the 98 total US hotel projects that broke ground or were in the pre-construction phase this year have been paused, according to previously unreported data shared with Reuters by Build Central Inc, a subscription based research and analytics firm used by some large hotel brands to gauge market opportunities by location.” I bolded the comment.
From the CIO of MCR Hotels, the 3rd largest US owner-operator of hotel brands, including Hilton, “The regional banks that used to be active for us 9 to 12 months ago are not showing up to finance hotels for us today.”
Yes, private equity is trying to step into the breach but offering 9-10% interest rates does not get a project done vs 4% a few years ago.
Bottom line, the bank credit crunch has only just begun. //www.reuters.com/business/finance/us-hotel-developers-run-out-cash-construction-lending-dries-up-2023-06-05/
Black Knight had a story yesterday on residential real estate titled “Tightening Credit Availability Adds to Affordability Struggles as Rates Remain Elevated, Inventory Shortages Worsen and Home Prices Strengthen.” Their data “showed home sales volumes fell in April, as a lack of both affordability and inventory continue to create major market headwinds.” On inventory, “for-sale inventory is now at its lowest level since April 2022, with inventory deteriorating in 95% of major markets since the start of 2023.” Home prices rose again in April as a result m/o/m, up for a 4th month but are now flat y/o/y which is the first time they haven’t been higher “since the market began to recover in the wake of the GFC.”
We know the home builders are trying to fill the inventory gap but affordability challenges exist there too and why they are still employing incentives.
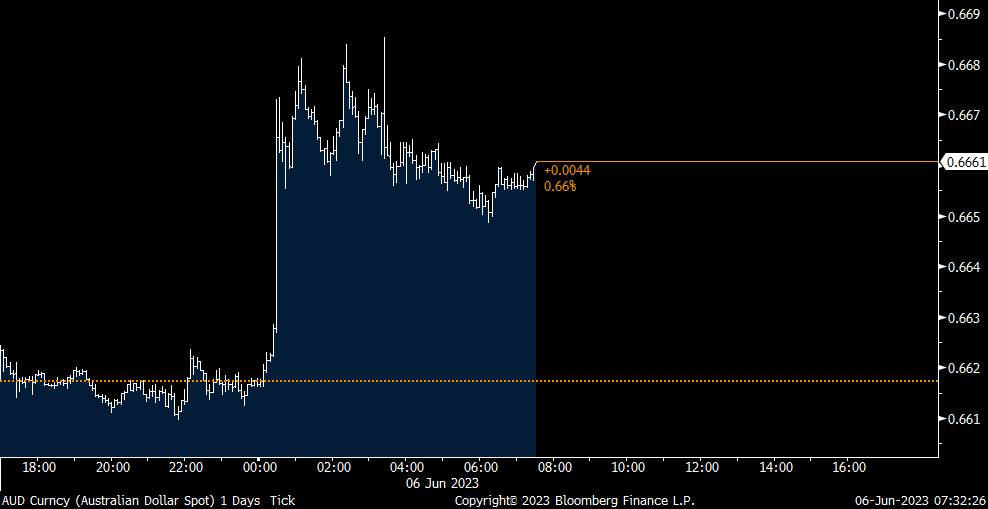
The Reserve Bank of Australia surprised everyone with a 25 bps rate hike to 4.10%. Governor Lowe left open the door for more, “Some further tightening of monetary policy may be required to ensure that inflation returns to target in a reasonable time frame, but that will depend upon how the economy and inflation evolve.” He seemed to be honing in on rising labor costs as the impetus for the hike with labor productivity little changed, “unit labor costs are also rising briskly, with productivity growth remaining subdued…The Board remains alert to the risk that expectations of ongoing high inflation contribute to larger increases in both prices and wages, especially given the limited spare capacity in the economy and the still very low rate of unemployment.” The Aussie$ is rallying by .6% to a 3 week high and yields are higher too. The ASX fell 1.2%.
Intraday Aussie$ move
Base pay did improve in Japan in April, rising by 1.1% y/o/y, a 4 month best but still running well below the rate of inflation which is around 4%. The BoJ is closing in again on some very tough decision making as they try to balance inflation rising twice their target at the same time the Japanese government needs continued low rates to finance their huge financing needs.
Singapore’s May PMI fell to 54.5 from 55.3 and vs 52.6 in March. S&P Global said “Underpinning the latest private sector expansion was a sustained improvement in new orders. Demand for Singaporean goods and services continued the streak of growth that began since the start of 2023, further rising at the fastest rate since last November on the back of better underlying demand and increased consumer spending.” The caveat, “Business confidence across the private sector remained relatively subdued, however, reflecting historically sharp cost pressures.” We remain bullish and long Singaporean stocks.
Germany factory orders fell .4% m/o/m in April, well below the estimate of up 2.8%. They are lower by 10% y/o/y. Foreign orders and those to the rest of the Eurozone fell but did rise domestically after the sharp drop in March. The world is in a manufacturing recession and that is felt most acutely in Germany.
END
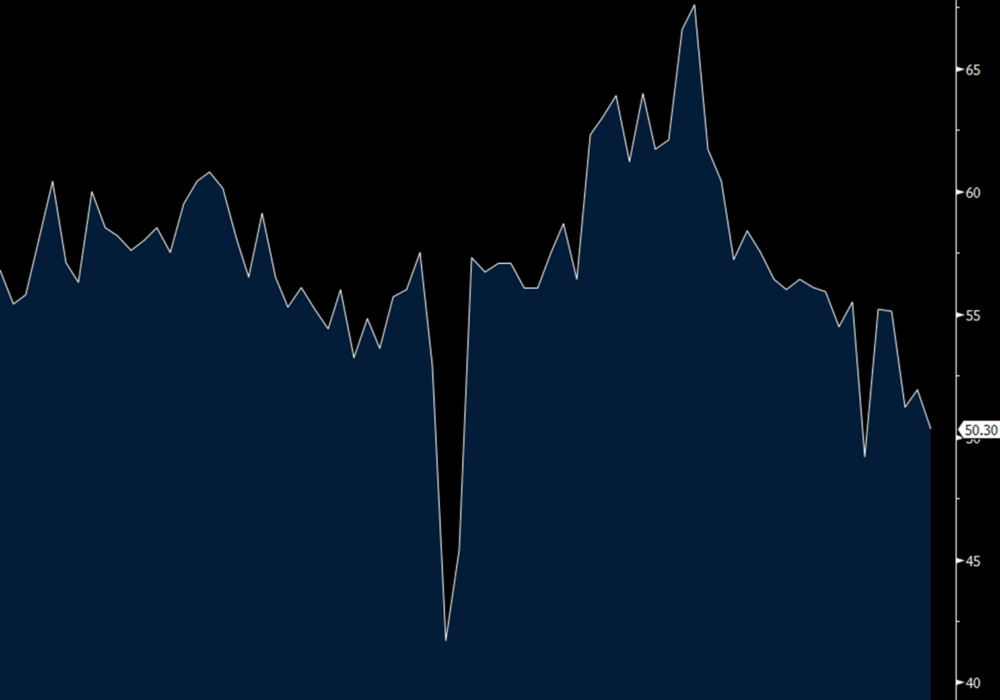
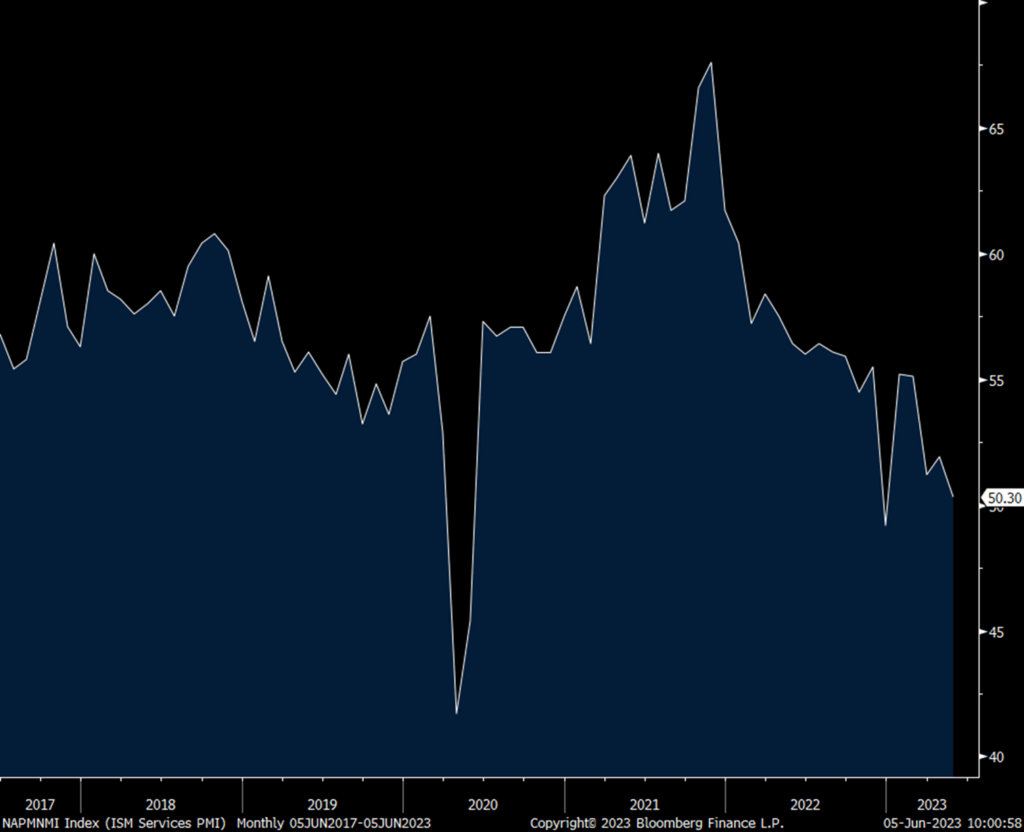
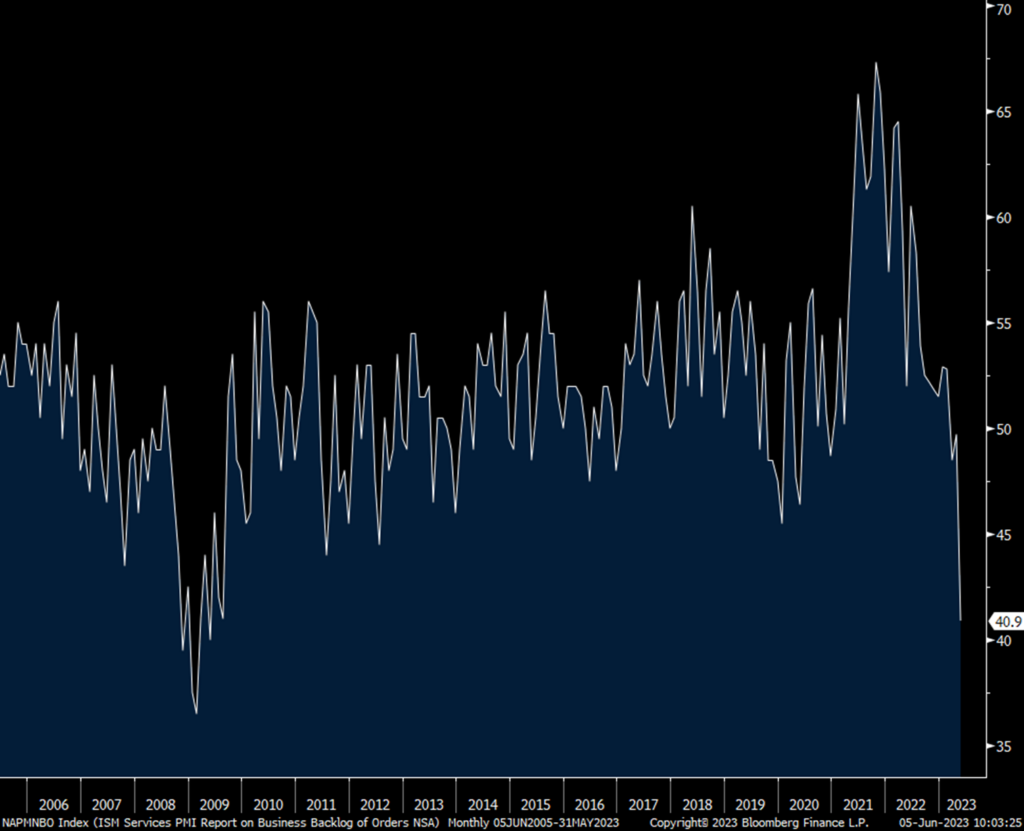
The May ISM services PMI unexpectedly fell to just above 50 at 50.3. That’s down from 51.9 in April and below the estimate of 52.4. New orders fell by 3.2 pts m/o/m to 52.9 and backlogs shrunk to just 40.9, down a large 8.8 pts m/o/m. Go back to May 2009 the last time we saw a weaker number. Inventories rebounded by 11.1 pts to 58.3 and that is the most since February 2021 which combined with the plunge in backlogs assumes that backlogs might have further to fall before new orders pick up (58% of service companies have inventories as the balance either don’t have any or don’t measure them). Supplier deliveries continued to retrench, highlighting the continued ease of supply chain constraints. Prices paid fell 3.4 pts to 56.2, the lowest in 3 yrs.
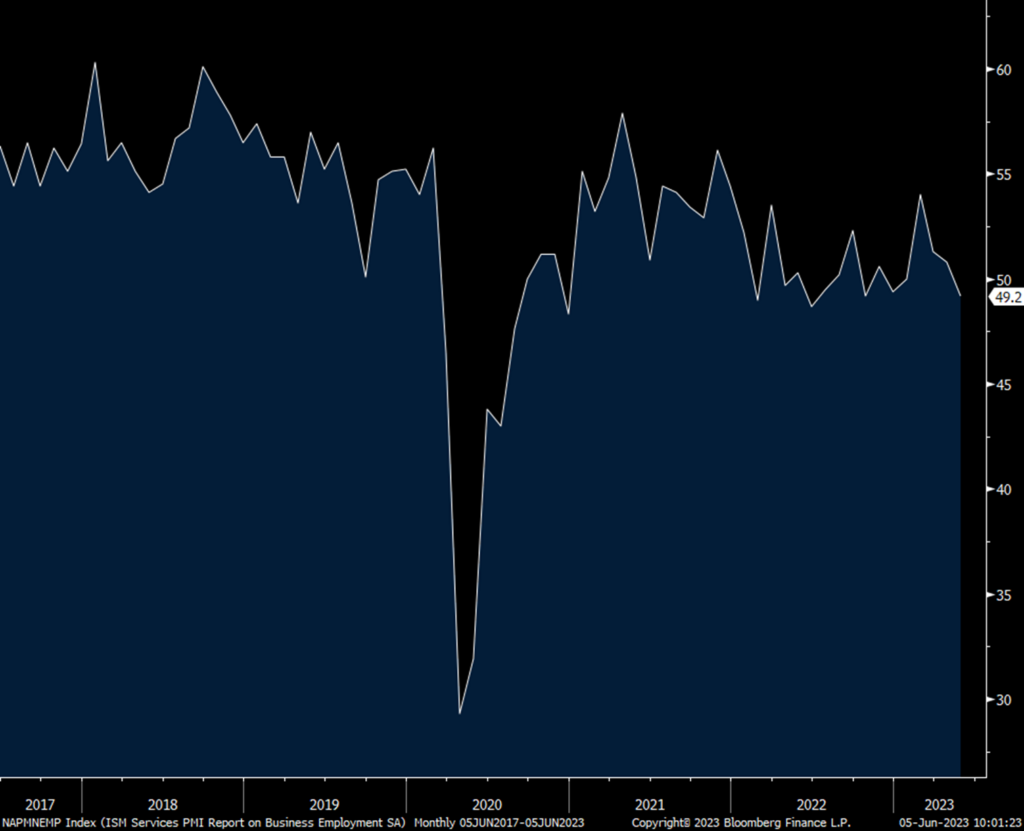
In contrast to the blow out establishment payroll report, the employment component fell back into contraction at 49.2 from 50.8 and that matches the lowest since June 2022. Only half of the 18 industries asked saw a rise in employment. Some quotes on hiring include: “We are trying to do more with the same staff because margins in the industry have compressed” and “Our company is currently on a hiring freeze until there’s a better understanding of where the economy is headed.”
Industry breadth deteriorated too as only 11 industries saw growth of the 18 surveyed. That compares with 14 in April. Seven saw a contraction vs 3 last month.
ISM bottom lined the report by saying “There has been a pullback in the rate of growth for the services sector. This is due mostly to the decrease in employment and continued improvements in delivery times and capacity, which are in many ways a product of sluggish demand. The majority of respondents indicate that business conditions are currently stable; however, there are concerns relative to the slowing economy.”
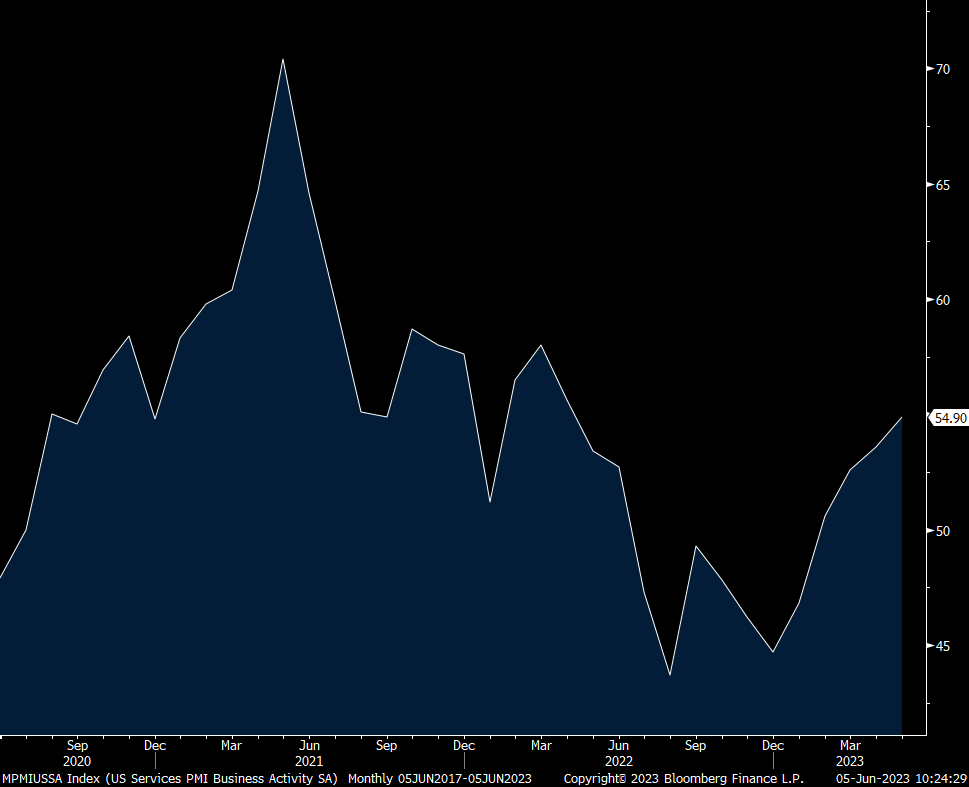
While this report was soft, we can thank the S&P Global services PMI in confusing the picture, though the latter doesn’t include ag, mining, utilities, construction, retail and wholesale trade while the former does. Also, S&P Global includes more small and medium sized businesses. The PMI rose to 54.9 from 53.6 and S&P Global highlighted particular strength, which we’re well aware of, in “travel, tourism, recreation and leisure.” The employment component was higher.
The net result in the Treasury market was for it to believe the ISM and that’s why yields fell immediately after the print. The 2 yr yield is back below 4.5% and the 10 yr is back under 3.70%. Rate hike odds in July went from 84% to 68%.
ISM Services
Employment
Backlogs
S&P Global US services PMI
END
I finally found something that Jay Powell and I have in common and agree upon, //twitter.com/deadandcompany/status/1665414009686835214.
With respect to next week, the soon to be Vice Chair Jefferson told us all we needed to know about what they are going to do and that is nothing. That said, the market thinks they go in July, pricing in an 84% chance right now. “If you get confused, just listen to the music play.”
Outside of today’s ISM services report and Thursday’s claims data, there isn’t much economic news ahead of next week’s CPI and Fed meeting. The earnings flow slows to a trickle (thankfully a break from earnings calls). We’ll of course watch to see if there is oil price follow thru as the Saudi’s themselves try to hold up prices (we remain bullish and long energy stocks). So we watch instead flows, debate what happens post debt deal with issuance and who is going to buy it all and at what yield, discuss how the Fed will balance a pause and maybe another hike while continuing on with QT and hear more chatter about AI.
When China reported its state sector weighted May manufacturing and service PMI’s a few weeks ago, the dour mood on China continued on but the Caixin private sector manufacturing index reflected a better tone and today’s service index from them did too. Also, the China Beige Book expressed a better picture than feared. The Caixin service sector index rose to 57.1 from 56.4. Also, “Service providers remained optimistic partly because the market environment improved in the post Covid era. However, the measure of their expectations for future activity declined for the 4th straight month, and slipped below the historical average.”
The China bashing is seemingly a non stop thing thing to do that everyone tries to top the other on the rhetoric but it serves no one, except maybe the military and other hawks, to not have us get along. The world badly needs both countries to stabilize this hugely tension filled situation. As a reminder, we buy about $500b of stuff from China each year and we sell about $150b worth of things to them. The Shanghai comp was flat but stocks in Hong Kong rallied.
Japan stocks by the way made fresh 33 yr highs.
India remains a very exciting story and its May service PMI remained above 60 at 61.2 but down slightly from the 62 seen in April.
Hong Kong’s PMI fell to 50.6 from 52.4 and Indonesia’s was right above 50 at 50.3 vs 52.7 in the month before.
The May Eurozone services PMI was revised down to 55.1 from its initial print of 55.9 and down from 56.2 in April. S&P Global said “The services sector is being supported by the strong labor market, rising wages and a tourism sector that is flourishing throughout Europe.”
The UK services PMI was left little changed at 55.2 vs the initial read of 55.1. That compares with 55.9 in April but up from 52.9 in March. S&P Global said it was “fueled by resilient demand for consumer and technology services, combined with a post pandemic tailwind as households switched from spending on goods to services. Rising export sales were also reported in May, reflecting increased international visitor numbers and improving demand for business services from clients based in the US and Europe.” Wage growth remained strong.
European bonds are selling off again with yields jumping, following weakness in Asia and here in the US. The ECB has more rate hikes as they have their deposit rate at a still low 3.25% but likely not many left. I think big question is how they manage the balance sheet decline from here.
END
Succinct Summation of the Week’s Events:
Positives,
1)We can stop talking about the debt ceiling at least through next year.
2)May payrolls grew by a whopping 339k, well more than the estimate of 195k. The private sector contributed 283k of this (similar to what ADP said yesterday) vs the forecast of 168k. The prior two months were revised up by 93k in total. The participation rate held at 62.6%. The important 25-54 age cohort saw its participation rate tick up again to 83.4% from 83.3% and that’s above the February 2020 level of 83%.
3)Initial jobless claims totaled 232k, 3k below the estimate and vs 230k last week. The 4 week average was 230k vs 232k in the week before. Continuing claims rose 6k w/o/w to just under 1.8mm at 1.795mm, about as forecasted.
4)Job openings in April rose to 10.1mm and that’s up from 9.75mm in March (revised up from just under 9.6mm). The hiring rate though remained unchanged at 3.9%
5)Comments this week from Fed Governor Jefferson, followed by voting member Harker, point to a time out on the rate increases.
6)The Conference Board’s May consumer confidence index was 102.3 and while that was 3 pts above the estimate, it’s down from 103.7 in April which was revised up by 2.4 pts. This compares with 104 in March, 103.4 in February and 106 in January. Both the Present Situation and Expectations components were lower m/o/m. One yr inflation expectations fell one tenth to 6.1% and that is the smallest since December 2020. That compares with 5% in the 20 yrs leading into Covid. The answers to the labor market questions softened.
7)Home prices in March, thus somewhat dated and reflecting just the beginning of the important spring transaction season, rose .66% y/o/y following a 2.1% rise in February according to S&P CoreLogic. The comparisons were very tough as prices rose 21% in March 2022 which came after rising by 13.5% in March 2021. From a m/o/m standpoint, home prices rose for a 2nd month by .4% and follows a string of declines. To this, S&P said “Two months of increasing prices do not a definitive recovery make, but March’s results suggest that the decline in home prices that began in June 2022 may have come to an end. That said, the challenges posed by current mortgage rates and the continuing possibility of economic weakness are likely to remain a headwind for housing prices for at least the next several months.” The cities with the quickest pace of gains continues to be in the sunbelt, Miami, Tampa, Charlotte and Atlanta. The laggards were seen in Seattle, San Francisco, San Diego and Las Vegas.
8)In the bank loan data from the week ended 5/24, bank deposits rebounded by $86b after the rise of $30b last week. I guess banks are further raising rates paid on these deposits in order to stem the flight.
9)From LULU: “our business remained strong in North America and across our international regions…Guests responded well to our spring merchandise assortment.” They saw particular strength in China, “ahead of our expectations in just one more sign of the potential within this market.”
10)The China private sector weighted Caixin May manufacturing index rose to 50.9 from 49.5 and better than the estimate of no change. They said “Both supply and demand expanded, but employment sank to a 3 yr low. Businesses stepped up purchasing, inventories of raw materials grew marginally, logistics picked up, prices continued to slump, and manufacturers’ optimism wavered.”
11)China Beige Book said its “new May data saw topline growth notch its best performance since 2019, even as a new wave of Covid cases hits home. Consumption drove the improvement, with Retail finally seeing broad based gains while all of our inflation gauges accelerated meaningfully for the first time this year. Manufacturing activity defied rumors of demise, though soft demand from Western economies remains a major headwind.” No surprise that its property sector remains under pressure.
12)India’s manufacturing PMI which rose 1.5 pts to 58.7. Japan’s final read was 50.6 vs 49.5.
13)Japan’s unemployment rate in April fell to 2.6% from 2.8% while the jobs to applicant ratio held at 1.32, well off the post Covid lows but down from 1.45 in February 2020.
14)Vietnam’s exports in May fell 5.9% y/o/y, not as bad as the 10.3% decline expected.
15)South Korea’s May exports fell 15.2% y/o/y but a touch better than the forecasted drop of 16.3%.
16)Eurozone inflation saw no increase in May vs the estimate of up .2%. The y/o/y gain slowed to 6.1% from 7%. The core rate was up 5.3% y/o/y, 2 tenths below expectations and down from 5.6% in April.
Negatives,
1)In contrast to the establishment survey, the household survey said 310k jobs were lost in May and combine this with the 130k person rise in the labor force resulted in a rise in the U3 unemployment rate to 3.7% from 3.4%. The all in U6 was up one tenth to 6.7%. Hours worked declined again to 34.3 from 34.4 and which matches the lowest amount since 2011 not including the April 2020 Covid drop. Following the decline in the quit rate we’ve seen in JOLTS, job leavers as a % of unemployed slowed to 12.6% from 13.8% in April, 14.2% in March, 14.8% in February and 15.3% in January. Average hourly earnings rose .3% m/o/m as expected but April was revised down by one tenth. Versus last year they are up 4.3% vs 4.4% in April. Combine this with the drop in hours worked and there was no change m/o/m in average weekly earnings, though still up 3.4% y/o/y.
2)The May ISM manufacturing index fell a touch to 46.9 from 47.1 and about as expected. It does mark the 7th straight month of manufacturing contraction. New orders fell down to 42.6 and backlogs stand at just 37.5. Of the 18 industries surveyed, just 4 saw growth and 14 are experiencing a contraction vs 5 up and 11 down in April.
3)This is what S&P Global said in their US mfr’g report which fell back under 50 at 48.4: “May saw a renewed deterioration of business conditions in the US manufacturing economy which will add to concerns about broader economic health and recession risks…Unless demand picks up, production growth will move into decline seen as it is clearly unsustainable to rely solely on backlogs of orders, which are now being depleted at the fastest rates for three years. Hence companies are cutting back sharply on their input buying and seeking to minimize inventory, tightening their belts for tough times ahead.”
4)Within the April JOLTS data, the quit rate fell to 2.4% from 2.5% and that is the lowest since January 2021.
5)Challenger’s May layoff report saw a 20% rise in layoffs m/o/m and up by 287% y/o/y. They said “Consumer confidence is down to a 6 month low and job openings are flattening. Companies appear to be putting the brakes on hiring in anticipation of a slowdown…With the exception of Education, Government, Industrial Mfr’g, and Utilities, every industry has seen an increase in layoffs this year.” Tech and retail led the way in job cuts.
6)With the 30 yr mortgage rate now back to 7%, purchase applications fell 2.5% w/o/w and down 31% y/o/y. Refi’s were lower by 7% w/o/w and by 45% y/o/y.
7)Vehicle sales in May totaled 15.05mm, below the estimate of 15.3mm and compares with 17.3mm in May 2019.
8)In the bank loan data from the week ended 5/24, C&I loans outstanding fell by another $4.3b to the lowest level since last October.
9)Some tech earnings comments:
From Salesforce: “we are still operating in an uncertain macro environment. Customers continue to scrutinize every deal and we see elongated deal cycles and deal compression, particularly in our more transactional revenue streams…Also in Q1, our professional service business starting to see less demand for multiyear transformations, and in some cases delayed projects as customers focused on quick wins and fast time to value.”
From HPQ: “As expected, the industry wide headwinds we described last quarter continue to impact our business…Looking first at the market level, global economic uncertainty remains elevated. The macro environment is challenging across most geographies. We continue to see cautious consumer discretionary spending while enterprises are delaying capital investments.”
From HPE: “In the 2nd quarter, we saw some decline in the health of microeconomic conditions, causing unevenness in customer demand, particularly in general purpose compute. We also see unevenness when comparing customer size, industry or geography…In the last few months, sales cycles have elongated, because customers are more reluctant to quickly commit to large projects or some will seek additional internal approvals at the time of their order.”
From BOX: “We did want to call out kind of an incremental element of softness on the SMB (small and medium sized businesses) front in the US.”
10)Dollar General: “The macroeconomic environment is more challenging than the Company had previously anticipated, which the Company believes is having a significant impact on customers’ spending levels and behaviors.”
Capri: “With Versace, Jimmy Choo, and Michael Kors, we have three incredibly powerful brands to drive growth. We recognize there are near term uncertainties in the Americas. However, we are encouraged by the strong trends in Asia and continued growth in EMEA.”
Macy’s: “We planned the year assuming that the economic health of the consumer would be challenged, but starting in late March, demand trends weakened further in our discretionary categories.”
11)South Korea’s May manufacturing PMI was 48.4 vs 48.1, Taiwan’s fell to 44.3 from 47.1, Vietnam’s to 45.3 from 46.7, Malaysia’s dropped 1 pt to 47.8 and Thailand’s dropped to 58.2 from 60.4. Australia’s final print was 48.4 vs 48 and is below 50 for a 3rd month.
12)China’s state sector focused manufacturing PMI fell to 48.8 from 49.2 and vs the estimate of 49.5. The service piece was down 1.9 pts to 54.5 which was below the estimate of 55.2.
13)The final Eurozone manufacturing May PMI figure was 44.8, below 50 for the 11th straight month and this print was the weakest of them all. S&P Global said “The downturn in the manufacturing sector is geographically broad-based…The decline in new orders from home and abroad signals that the weakness in output is likely to persist for several more months.”
14)The final UK May manufacturing PMI was 47.1, in contraction for a 10th month and down from 47.8 in April. S&P Global said “Manufacturers are finding that any potential boost to production from improving supply chains is being completely negated by weak demand, client destocking and a general shift in spending in the UK away from goods to services. These factors are also driving a broad decrease in demand from overseas amid reports of lost orders from the US and mainland Europe. The retrenchment in export demand is also being exacerbated by some EU clients switching to more local sourcing to avoid post-Brexit trade complications.”
15)The May Economic Confidence index for the Eurozone fell to 96.5 from 99 and that was 2.3 pts below expectations. That’s also a 6 month low. Manufacturing, services, retail and construction components all weakened while consumer confidence was little changed but at the best level since February 2022.
May payrolls grew by a whopping 339k, well more than the estimate of 195k. The private sector contributed 283k of this (similar to what ADP said yesterday) vs the forecast of 168k. The prior two months were revised up by 93k in total. In contrast, the household survey said 310k jobs were lost in May and combine this with the 130k person rise in the labor force resulted in a rise in the U3 unemployment rate to 3.7% from 3.4%. The all in U6 was up one tenth to 6.7%.
The other fly is that hours worked declined again to 34.3 from 34.4 and which matches the lowest amount since 2011 not including the April 2020 Covid drop. Following the decline in the quit rate we’ve seen in JOLTS, job leavers as a % of unemployed slowed to 12.6% from 13.8% in April, 14.2% in March, 14.8% in February and 15.3% in January.
Average hourly earnings rose .3% m/o/m as expected but April was revised down by one tenth. Versus last year they are up 4.3% vs 4.4% in April. Combine this with the drop in hours worked and there was no change m/o/m in average weekly earnings, though still up 3.4% y/o/y. Earnings growth has clearly plateaued and tough comps are contributing too to the moderation (they grew by 5.5% in May 2022).
The participation rate held at 62.6%. The important 25-54 age cohort saw its participation rate tick up again to 83.4% from 83.3% and that’s above the February 2020 level.
It was the service sector that carried the month, adding 257k jobs vs 225k in April. Leisure and hospitality hired a net 48k vs 30k in April and 46k in March. After months of declines, the temp sector added 8k. Information cut 9k but we know this has been an area of jobs weakness. Private education/health stepped up its hiring. Professional business services added 64k, holding steady with April.
With goods, manufacturing shed 2k in the midst of its recession. Construction hired a net 25k vs 13k in the month before.
The birth/death model added 231k which compares with 213k in May 2022 and 204k in May 2019. Thus, not much of a difference but in turns in the economy, it overstates the contribution on the cusp of an economic downturn and understates it as the economy comes out of a recession.
Bottom line, there are some big mixed signals in this report. Firstly, with GDP growth still trending at best around 1%, this type of job growth means that productivity continues to suck wind. Secondly, the drop in hours worked is a clear message that employers are still reluctant to shed workers but at the same time has them working less because of tempered end demand. Thirdly, that household survey told a different jobs story than the headline establishment figure.
Yields are focused on the headline report and they are jumping but I still think the Fed does not hike in a few weeks.
END
 Peter is the Chief Investment Officer at Bleakley Advisory Group and is a CNBC contributor. Each day The Boock Report provides summaries and commentary on the macro data and news that matter, with analysis of what it all means and how it fits together.