• Skip to main content
  • Skip to primary sidebar
  • Skip to footer

The Boock Report

  • Home
  • Free Content
  • Login
  • Subscribe

August 4, 2016 By Peter Boockvar

Jobless Claims, BoE/Carney, Europe

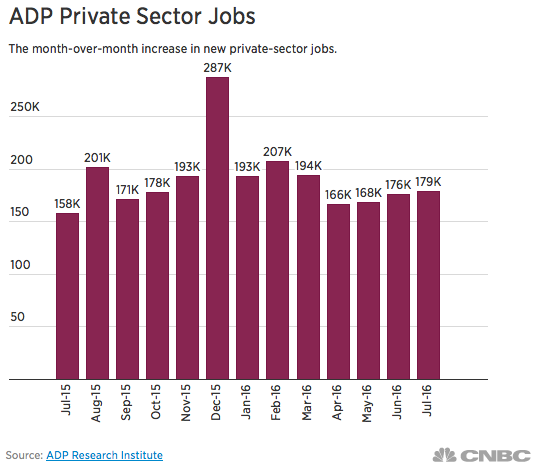
Initial jobless claims rose 3k w/o/w to 269k which was 4k above the estimate. As a 254k print dropped out of the 4 week average, the new 4 week average rose to 260k from 257k. Continuing claims, delayed by a week, fell 6k after rising by 12k last week. Bottom line, ahead of tomorrow’s July payroll report, the pace of firing’s remains modest for the reasons we’ve known for a while. And we’ve learned too that a benign pace of firing’s doesn’t contradict a slowing rate of job growth. As I also stated yesterday within the ADP summary, we must watch out to see if a slowing rate of profit growth and a shrinkage in margins will at some point have an impact on hiring intentions. Tomorrow’s estimate is for 180k. I’m taking the under to something closer to the 3 month average of about 150k.

Not only did the BoE cut interest rates by 25 bps as fully expected, they expanded sovereign QE by 60b to 435b from 375b pounds and they are adding a corporate bond buying program but that is modest, just 10b pounds over the next 1 ½ years. They also added a short term lending program for banks to cushion the impact of low rates. The vote was 9-0 to cut rates but there were 3 dissents on sovereign QE and 1 on the corporate bond buying. As to be expected the pound is getting hammered and gilts are spiking higher with the 10 yr falling by 16 bps. Their 2s/10s spread is narrowing by 4 bps to the lowest in 8 years. Sorry banking system.

Bottom line, the BoE is now falling further into the same trap as the Fed, BoJ and ECB and for some reason hoping to see a different result. An even lower cost of money is not going to change any behavior but at the same time an ever flatter yield curve will further damage bank profitability. Pension funds, insurance companies and savers will be further starved for returns. Unfunded pensions will suck further funding from corporations away from growth initiatives. Further down the line, as the Fed is experiencing now, how does the BoE expect to get out of this. I thought for a moment that maybe Mark Carney was different than his peers but he today has proven that he is just the same as the others in believing too highly of the abilities of central banks to generate economic growth and showing no sense of humility about their effectiveness. Creating asset bubbles is their only real skill set.

The Markit eurozone retail PMI for July rose a touch to 48.9 from 48.5 in June. It does mark the 7th month in the past 9 being below the breakeven of 50. Markit said “While German and French retailers are enjoying periods of steady sales growth, their counterparts in Italy have endured back to back steep decreases in sales of the likes not seen for over 2 ½ years.” Both the German and French indices are above 50 while Italy’s is down at 40.3. In terms of overall pricing, “purchase price inflation quickens slightly from June’s 16 month low.” If the ECB is successful in generating higher inflation, retail sales in the region would only worsen.

August 3, 2016 By Peter Boockvar

ISM, ADP, Services PMI’s, Mortgage Apps

The July ISM services index fell 1 pt to 55.5 which was a touch below the estimate of 55.9 but is still above the average year to date of 54.6. This compares with the 2015 average of 57.2. New orders rose .4 pts to the best since October at 60.3 although there was a drop in the number of companies seeing an increase to 13 from 15 surveyed in June. Backlogs rose 3.5 pts to 51 after dropping by 2.5 pts in June and puts it back to its 6 month average. Employment fell 1.3 pts to just above 50 at 51.4. Export orders, where only a few service companies report them, rose 2.5 pts to 55.5. Prices paid fell 3.6 pts but at 51.9 is just in line with the half year average. Similar to June, 15 industries saw growth of the 18 surveyed. The ISM summed up the report by saying “the majority of the respondents’ comments reflect stability and continued growth for their respective companies and a positive outlook on the economy.”

Bottom line, reading the ISM release and one gets the impression that everything is copacetic but Markit’s version of services is more guarded as their index is barely above 50. In their release today where the index was 51.4 vs 50.9 in June they believe Q3 growth is holding “at around 1%” which is what was seen in the 1st half of 2016. Hopes for a rebound in Q3 is evident though as business confidence about the outlook rose to the best since January. The truth on growth lies somewhere in the middle between ISM and Markit but the reality on growth this year is that it will have a 1 handle on it, the slowest pace of gain in years.

ADP said that in July a net 179k private sector jobs were created, a bit better than the estimate of 170k and up from 176k seen in June (revised from 172k). All of the gains were seen in the service sector as it contributed 185k jobs but that is down from 203k in June. The goods side saw job cuts of 6k but not as bad as the 27k lost in June. Construction shed jobs for a 2nd month while manufacturing added 4k jobs after shedding 15k in June. ADP is attributing some of the overall job growth slowdown to small businesses “as the labor market continues to tighten, small businesses may increasingly face challenges when it comes to offering wages that can compete with larger businesses.”

Bottom line, notwithstanding the better than expected print, the slowing hiring trend continues. The 3 month average job gain is now 174k and the 6 month average is 180k. These figures compare with job growth of 207k in 2015 and 234k in 2014. On one hand, employers are running out of qualified warm bodies to hire but also, slowing profits and shrinking profit margins don’t lend itself to a pick up in hiring.

China’s private sector weighted services PMI index fell 1 pt to 51.7 which is about in line with the year to date average of 51.9. This follows the improvement in their manufacturing index and Caixin said this about the services sector, “All of the index categories showed signs of deterioration, with employment falling back into the territory of contraction after 3 consecutive months of growth.” Japan’s services index rose 1 pt to barely back above 50 at 50.4. Hong Kong’s PMI rose 1.8 pts but to only 47.2 as the Chinese slowdown continues to weigh. Singapore’s PMI fell by 1.6 to near 50 at 50.7. India’s services bounced 1.6 pts to 51.9. Bottom line, Asian PMI’s for both services and manufacturing continue to hover around 50, give or take a few points. Asian stock markets were weak across the board and sovereign bond weakness followed what was seen yesterday in Japan, Europe and the US. In particular, the Australian 10 yr yield jumped by 11 bps.

The services PMI for Europe was revised to 52.9, a touch better than the first read of 52.7 and is up .1 from June but that was the slowest pace of expansion since January ’15. This brings the services and manufacturing composite index to 53.2 from 53.1 in June. With services, “all of the ‘big four’ national services economies reported growth of business activity, incoming new orders and employment during July. However, optimism regarding future performance fell to a 19 month low with business confidence easing across Germany, France, Italy and Spain.”

The UK services PMI for July, a post Brexit print, fell to 47.4 from 52.3. This is a downward revision from the initial July print of 48.8 as “services output and new business both fall at the fastest rates since March 2009” and “expectations fall to the weakest since February 2009.” This data point continues a string of very weak sentiment data but we need more time to see if this is a knee jerk emotional response to the UK vote or something more longer lasting because of all the unknowns to come. With the BoE meeting tomorrow, are they going to expend what little bullets they have left for a hoped for reward that is likely specious with rates already so low? Will they essentially give in to peer pressure to ‘do something’ or acknowledge there is not much more they can do? The pound and gilt yields are little changed as the market has about fully priced in a 25 bps rate cut.

Retail sales in the Euro region in June was flat m/o/m, in line with the estimate and the y/o/y gain of 1.6% matches what was seen in May. These numbers are pre UK vote and there is an important standoff between the European consumer and the ECB. The consumer is dealing with sluggish wage growth, decent job growth and terrorism fears while the ECB is trying to drive higher their cost of living.

With it being a constant focus, the euro STOXX bank index is rebounding by 1.4% after the 7.5% drubbing in the prior 2 days. ING and Soc Gen are leading the way after earnings and the Italian banks are up as well after an ugly few days.

After a rough 3 days, most JGB’s were little changed overnight with the 10 yr yield at -.08%. However, yields for longer dated paper rose again as the Japanese government said they were going to issue more 40 yr JGB’s. Smart to term out that far with rates so low but it also brings extra supply. The Nikkei fell another 1.9% to a 3 week low. Question to all those Keynes lovers over the past 25 years, what’s next?

In the US, mortgage applications to buy a home remains very uneven. They fell 2.4% w/o/w and are down for three straight weeks and the y/o/y rise slowed to 6%. The housing recovery continues but still in a choppy fashion. The index is at the lowest level since February. Refi applications fell 4.2% w/o/w, down for a 3rd week but are still higher by 56% y/o/y.

Stock market sentiment according to II changed only a bit. Bulls fell 1 pt to 52.9. Two weeks ago it hit the highest since April 2015 at 54.4. Bears though also fell by .4 pts to a 14 week low at 21.2. The bull/bear spread thus narrowed by .6 pts off the widest since July 2015. The Correction side is where everyone went as it was higher by 1.4 pts to 25.9. Two weeks ago it touched the lowest since June 2014. Bottom line, sentiment is still pretty giddy and showing little fear in the face of an extraordinary amount of risk in my opinion.

August 1, 2016 By Peter Boockvar

July ISM Still Above 50, UK PMI Not So Much, Bottom in Bond Yields?

The July ISM manufacturing index fell .6 pts to 52.6 which was a touch below the estimate of 53.0 and down from 53.2 in June which was a jump from 51.3 in May. New orders were basically unchanged at 56.9 vs 57 last month with 12 industries of 18 surveyed seeing growth, the same as in June. Backlogs however fell 4.5 pts to back below 50 at 48 after jumping by 5.5 pts in June. Inventories rose 1 pt at the manufacturing level but is still below 50 at 49.5. Customer inventories held at a 6 month high and follows the destocking we saw in the Q2 GDP report which means maybe some more destocking is needed. Employment weakened by 1 pt to 49.4 and marks the 8th month in the past 10 below 50. Export orders fell 1 pt to 52.5 but is above 50 for the 5th straight month. Prices paid moderated by 5.5 pts coincident with the drop in energy prices. Of the 18 industries surveyed, 11 saw growth vs 13 in June.

Bottom line, notwithstanding the slight decline m/o/m manufacturing in the US has stabilized with the ISM index above 50 for the 5th straight month and a touch above the 6 month average of 51.5. The topping out of the US dollar, steady state in Europe ex the UK and stimulus induced calm in China are likely the reasons. We’ll also see if we get some inventory building again in the 2nd half after the 1st half drawdowns. That said, with global trade still soft, energy prices falling again, cap ex punk and questions growing about the US consumer (on the heels of Ford’s comments and from some quick serve restaurant companies), I don’t see reason for any acceleration from here anytime soon.

JGB’s were hammered again overnight with the 10 yr yield rising 5.5 bps after the 8 bps jump on Friday. At a yield of -.135% it is the least negative since June 9th. As anyone buying this paper is of course not doing it because they want to lock in a guaranteed loss (except the BoJ) but instead are hoping for a capital gain by selling it to some other moron, someone is getting hurt and it likely is not just the BoJ. The biggest bond bubble of them all is in Japan but with many widows having been made over the past decade calling an end to it I’m not going to try today but this story is worth watching if the BoJ is truly at the end of the logistical QE road with JGB’s.

China’s state sector weighted manufacturing PMI essentially flatlined at 49.9 vs 50 in June and the estimate of 50. The private sector weighted index did as well at 50.6 but that was up 2 pts m/o/m and above the forecast of 48.8. Caixin/Markit said “the sub indexes of output, new orders and inventory all surged past the neutral 50 pt level that separates growth from decline. This indicates that the Chinese economy has begun to show signs of stabilizing due to the gradual implementation of proactive fiscal policy. But, the pressure on economic growth remains.” It’s so tough to know what economic activity is real and what is temporarily juiced by fiscal stimulus. With respect to services, the state sector PMI rose .2 pts to 53.9 which is the best level of the year. The market response to the data was mixed overall as the Shanghai comp fell .9% but the H share index spiked by 1.9%. The yuan rallied.

Manufacturing PMI in South Korea fell .4 pts to just above the breakeven at 50.1. Indonesia’s PMI fell back below 50 while Malaysia’s remained below 50. Taiwan rose .5 pt to just above 50 at 51. Japan’s final read stayed below 50 at 49.3. India’s was little changed at 51.8. Bottom line, all are about just treading water.

South Korea continues to feel the collateral damage from slowing growth in China and weak global trade as its exports fell 10.2% y/o/y in July, more than the estimate of down 6.7%. This is now negative for the 19th straight month as exports fell to China, the US, Japan, the EU and to Latin America. Imports fell by 14% vs the forecast of down 10.5%. The Kospi shrugged off the weakness by rallying about .7% after the China data seen. Interestingly the Won is at the best level vs the US dollar in 2 months as the Fed again is put into the background by mediocre US data.

Europe’s manufacturing PMI in July was revised to a hair better read of 52 vs the first print of 51.9 but remains down from 52.8 in June. Markit said that most of the growth is being seen in Germany only “while growth has almost stalled in both Italy and Spain and contractions are being seen in France and Greece.” European markets are mostly lower with the STOXX bank index down 2.3%, giving back the Friday rally as everyone digs thru the stress test results.

Not surprisingly it was in the UK where the real weakness was seen as its July PMI fell to 48.2 from 49.1 and vs the estimate of no change. Markit said “the pace of contraction was the fastest since early 2013 amid increasingly widespread reports that business activity has been adversely affected by the EU referendum…The downturn was felt across industry, with output scaled back across firms of all sizes and across the consumer, intermediate and investment goods sectors, although exporters did report a boost from the weaker pound.” The real question we’ll hopefully answer in coming months is whether the July data was a short term emotional worry and economic paralysis that will stabilize once the initial shock of leaving wears off.

The only thing I have to say about Bill Dudley’s comment overnight that “it is premature to rule out further monetary policy tightening this year” is quote my friend Peter Tchir who referred to the Fed last week as “the boy who cried rate hike.”

July 29, 2016 By CC

7/29 – Succinct Summation of Week’s Events

Positives:
  1. The Employment Cost Index for Q2 saw private sector wages and salaries rise 2.6% y/o/y, the most since Q1 2015 and a pick up from the 2% gain in Q1. Benefits also rose by the most since Q1 2015 and by 1.7% y/o/y vs 1.2% in Q1.
  2. The Chicago PMI for July fell 1 pt to 55.8 but that was a bit higher than the estimate of 54. Smoothing out this very volatile number puts the 3 month average at 54 and the 6 month average to 52.2. Pointing to a possible economic rebound in Q3 from the punk 1st half of the year, “companies increased their inventories at the fastest pace since October 2015, building on June’s double digit gain.”
  3. The July Richmond manufacturing survey improved by 20 pts to +10, well better than the estimate of -5. The Dallas mfr’g index improved to -1.3 from -18.3 and is the least negative since December 2014.
  4. The Conference Board’s US consumer confidence index fell a hair to 97.3 in July from a revised 97.4 in June (revised from 98) but that was slightly better than the estimate of 96. The Present Situation component rose to the best level since September but Expectations moderated a touch. The data is “suggesting the economy will continue to expand at a moderate pace” while “consumers remain cautiously optimistic about growth in the near term” according to the Conference Board.
  5. New home sales in June totaled 592k annualized, 32k more than expected and up from 572k in May which was revised up by 21k. Sales now are at the most since February ’08 and continue to creep closer to the 25 yr average of 715k. Months’ supply fell to 4.9 from 5.1. The median price was up by 6.1% y/o/y to back above $300k.
  6. According to the Case Shiller home price index, prices fell for a 2nd straight month but only by the slightest amount. On a y/o/y basis, prices were higher by 5.2% but that was the slowest pace of gain since September. In order to bring back more forcefully the 1st time buyer, price gains need to slow to closer to the rate of inflation.
  7. The BoJ only modestly increased their QE program via more stock purchases while staying on hold with NIRP and JGB QE. Have they reached a logistical end of the road and if so, what does that mean broadly for global sovereign bonds?
  8. The Japanese jobless rate fell one tenth to 3.1%, the lowest since 1995 as hires exceeded the increase in the labor force and the jobs to applicant ratio rose to 1.37, the most since August 1991. Industrial production in June beat expectations. Exports in June fell 7.4% y/o/y but not as bad as the 11.3% drop that was anticipated.
  9. Hong Kong exports fell for the 15th month in the past 16 y/o/y. They fell 1% in June from last year but that was a bit better than the estimate of down 1.6%. While China said imports from Hong Kong in June rose 71% y/o/y, Hong Kong said exports to China were up just 1.8% y/o/y.
  10. South Korea’s economy grew 3.2% y/o/y in Q2, above the estimate of up 3%. Taiwan’s economy grew .7% y/o/y after 3 straight quarters of declines.
  11. Notwithstanding the results of the UK vote, Economic confidence in the Eurozone in July rose a touch to 104.6 from 104.4 in June and vs 104.6 in May. That was 1 pt more than expected and compares with the multi year high of 106.6 in December. Consumer confidence softened a bit but was offset by gains in manufacturing, services, retail and construction.
  12. The number of unemployed in Germany in July fell 7k, better than the expected drop of 4k. The unemployment rate held at 6.1% which is the lowest since reunification.
  13. Q2 GDP in the UK rose .6% q/o/q and 2.2% y/o/y, both a tenth more than expected. That y/o/y gain was the best since Q2 of 2015 but we certainly know to expect a sharp slowdown in Q3.
  14. Money supply growth in June in the eurozone rose 5% y/o/y, in line with the estimate and right in line with the average year to date. Household loans rose 1.7% y/o/y up a touch from the 1.6% gain seen in May and the same pace of gains were seen to non financial companies.


Negatives:
  1. The Fed revealed again that they have completely blown their exit opportunities.
  2. With the downward revision to Q1 to .8% and the Q2 growth rate of just 1.2% (well below the estimate of 2.5%) we now have a 1% average rate of growth so far this year and 1.2% over the past 4 quarters. Nominal GDP was just 3.4% in Q2. Inventory destocking and declines in capital investment were the main drags. Consumer spending rebounded and real final sales are averaging 1.8% over the past 2 quarters.
  3. Initial jobless claims totaled 266k, 4k more than expected and up from a revised 252k last week (initially was 253k). Because a 270k print 5 weeks ago drops out of the 4 week average, the new one fell to 257k from 258k last week and is just a hair above the lowest level since 1973. Continuing claims, delayed by a week, rose by 7k after the prior week’s drop of 21k.
  4. Pending home sales in June grew by .2% m/o/m which was below the estimate of up 1.2%. The NAR said “unfortunately for prospective buyers trying to take advantage of exceptionally low mortgage rates, housing inventory at the end of last month was down almost 6% from a yr ago, and home prices are showing little evidence of slowing to a healthier pace that more closely mirrors wage and income growth. Until inventory conditions markedly improve, far too many prospective buyers are likely to run into situations of either being priced out of the market or outbid on the very few properties available for sale.”
  5. Mortgage applications to buy a home fell 3.3% w/o/w after falling 2% in the week prior. This brings the index to the lowest level since early March while still up 12% y/o/y. Refi applications fell 15% w/o/w likely in response to the 4 week high in mortgage rates even though they still remain ridiculously low. They are up 72% y/o/y.
  6. Core durable goods order rose .2% m/o/m in June with May revised down by one tenth to a decline of .5%. It was in line with the estimate for up .2% but was still down 4.2% y/o/y. Durable goods ex transports were much weaker than expected as they fell .5% vs the estimate of up .3%. There was a .4% m/o/m drop in the shipments of core goods, well worse than the estimate of up .4%. Shipments of core goods were down 5.8% y/o/y.
  7. The Markit PMI services index for July slowed to 50.9, a 5 month low and down from 51.4 in June. It’s also the 2nd lowest print in years. Markit summed up the report by saying “The US service sector remained stuck in a low gear at the start of the third quarter of 2016, with growth of activity remaining subdued amid a slower rise in new business. This is particularly disappointing given the decent numbers posted by the manufacturing sector last week. A bit more encouraging was the rebound in business confidence following June’s survey low, suggesting that a return to stronger growth will be possible once the current soft patch comes to an end. Whether this will be before the presidential election or not remains to be seen, however.”
  8. The final read on July UoM consumer confidence saw its index fall to 90 from 93.5 in June. This though is a touch above the preliminary print of 89.5 and is basically in line with the estimate of 90.2. Confidence has fallen almost 5 pts over the past 2 months to the 2nd lowest print since October 2015. It is also below the average year to date of 91.7 which compares to the average in 2015 of 92.9 in 2015.
  9. Japanese overall household spending fell 2.2% y/o/y in June, much worse than the estimate of down .4%. Retail sales within that also fell more than expected y/o/y. Vehicle production, housing starts and construction orders were all negative y/o/y and inflation missed the estimates.
  10. Eurozone GDP for Q2 slowed q/o/q, rising by .3% q/o/q but was in line with expectations after a .6% gain in Q1. The y/o/y growth rate was 1.6% vs 1.7% in Q1. As we know this was pre UK vote, it is somewhat old news. The French economy was stagnant in Q2 vs Q1 as was Austria’s. Spain’s economy continues to be a bright spot as it grew by .7% q/o/q and 3.2% y/o/y, both about in line with forecasts. We’ll see Germany’s GDP report in a few weeks.
  11. Good for Mario, not so much the European populace, Eurozone inflation both headline and core rose one tenth more than expected. The core y/o/y rate of .9% matches a 4 month high.
  12. Not surprisingly, UK consumer confidence in July took a sharp hit as the GFK index fell to -12 from -1. It’s the biggest one month drop since 1990. The estimate was for a decline to -8 and the -12 print was the worst since December 2013. As to what comes next, GFK said “Its future trajectory depends on whether we enter a new period of damaging economic uncertainty or restore confidence by embracing a positive stance on negotiating a new deal for the UK.”
  13. As for economic sentiment in the UK, it also fell sharply in July to 102.6, the weakest since June 2013 from 107 last month with particular weakness in consumer and retail confidence but manufacturing, services and construction confidence fell as well.
  14. The July UK retail sales CBI index fell to -14 from +4, the biggest drop in 4 years and it’s at the lowest level since early 2012.


July 29, 2016 By Peter Boockvar

BoJ: Have They Reached the Logistical End of The Road?

What was most relevant from the BoJ was not what they did, it is what they didn’t do. Doubling their etf purchases is just more of the same and likely why the Nikkei rallied even though the yen is ripping higher. But, by not moving further into NIRP maybe is a reflection that Kuroda took note of the really cynical response on the part of both the Japanese banking system and Japanese households. Also, did the lack of any new bond purchases signal the realization that they’ve reached the logistical limits or is this just a pause before the Abe government reveals its next fiscal stimulus package? While maybe yes to the latter point, the JGB market sold off hard on the lack of new buying and maybe believes the former. The 10 yr JGB yield spiked 8 bps to -.19%, the least negative since June 27th, the Monday after the UK vote. Bottom line, if NIRP is now being repudiated as a good idea (thank heavens if it is) and limits are being realized in the amount of government bonds that can be purchased, was the blow off rally in global sovereign bonds post UK vote the end for now in the global bond market rally? I believe it is very likely. Yields are up in the UK, Germany, France and the US in sympathy with JGB’s.

Very importantly, Kuroda specifically said “the yield curve has become very flat. We will inspect our policy comprehensively, including what impact that flattened curve will have on the profitability of financial institutions.” Will they get off NIRP? This analysis will be part of a broad review for the next meeting in September on how they will get to 2% inflation. They should just get off that goal already as there is no empirical meaning to that number. Kuroda also said they are “not thinking of monetizing government debt at all.” That of course is semantics but he’s specifically talking about primary buying of debt from the Japanese government directly.

The economic data out of Japan overnight was mixed. The labor market (this is where the reform in Japan is most needed) remains tight as the jobless rate fell one tenth to 3.1%, the lowest since 1995 as hires exceeded the increase in the labor force and the jobs to applicant ratio rose to 1.37, the most since August 1991. The weakness was seen in overall household spending which fell 2.2% y/o/y, much worse than the estimate of down .4%. Retail sales within that also fell more than expected y/o/y. Vehicle production, housing starts and construction orders were all negative y/o/y and inflation missed the estimates. The only positive was IP beat expectations.

July 28, 2016 By Peter Boockvar

Market response to FOMC, Atlanta Fed, BoJ

TINA (‘there is no alternative’ to stocks which there never is in a bull market) and the dividend yield on stocks being higher than many bonds are the two main reasons being given for the persistent strength in large cap stocks. I don’t mean to pick on any one company but I want to use one as an example that if you’re going to ‘search for yield’ in stocks, remember that the potential for capital loss should be part of the analysis as it’s not just all reward. If one bought Equity Residential, the large apartment REIT on Monday because the 2.9% yield was so compelling relative to the 1.55% 10 yr bond yield, the stock lost 5.5% yesterday after a disappointing earnings report. Stocks are riskier than bonds as we all know and therefore comparing bond yields and dividends is an apples and oranges comparison. I’ll also ask this question, where is the historical study that shows a tight correlation with future equity returns when the earnings yield on the stock market is higher by a certain level against the risk free rate? There isn’t one because there isn’t a high correlation. Remember the Fed model? I found this chart from Mark Hulbert last week:

image003

My point is that the world’s central banks have no question left the investing landscape in disarray but I just wanted to bring some further perspective to some of the reasons some are giving to buy stocks as opposed to fundamental and valuation driven reasons.

The US market response to the FOMC statement was most interesting and confusing. The statement sounded a bit more hawkish as we know which I think was the right thing to do so as to give them flexibility. But, their game of day trading the data continues as they go back and forth depending what the monthly payroll numbers are. On one hand, the yield curve flattened further with the 2s/10s spread narrower by another 3 bps to just below 78 bps. On the other, the US dollar fell, gold rallied, stocks did nothing and the 2 yr yield still dropped. I think the real message is there are real global growth concerns and the belief that there is little chance the Fed hikes rates. Anecdotally, a major source of strength for the US economy over the past 5 years has been auto sales and Ford’s CEO today after the earnings release said he is expecting a y/o/y decline in retail in the 2nd half and said he can argue the SAAR for auto’s has peaked in this cycle.

Today, a day before we see the first look at Q2 GDP, the Atlanta Fed’s estimate today took a large 5 tenths cut to just 1.8% after seeing the advance trade and inventory data. Here is the link, //www.frbatlanta.org/cqer/research/gdpnow.aspx?panel=1. The consensus estimate for tomorrow prior to the new data today was at 2.6%. If the Atlanta Fed is correct (I emphasize IF), the first half growth rate would average just 1.4% and 1.6% over the past 4 quarters. Yes, I get the whole pile into anything with yield thing but the flattening of the US Treasury market is corroborating this slowing US growth trend.

The world of monetary madness now shifts to Japan and the yen rally and 1.1% fall in the Nikkei overnight just points to the jitteriness over what will be announced. The expectations bar is high but we should all expect only more of the same type of easing and please don’t expect a different result.

  • « Previous Page
  • Page 1
  • …
  • Page 650
  • Page 651
  • Page 652
  • Page 653
  • Next Page »

Primary Sidebar

Recent

  • July 1, 2023 The Boock Report is now On Substack
  • June 6, 2023 Travel remains strong and the credit crunch is on
  • Subscribe
  • Free Content
  • Login
  • Ask Peter

Categories

  • Central Banks
  • Free Access
  • Latest Data
  • Podcasts
  • Uncategorized
  • Weekly Summary

Footer

Search

Follow Peter

  • Facebook
  • LinkedIn
  • Twitter

Subscribe

About Peter

Peter is the Chief Investment Officer at Bleakley Advisory Group and is a CNBC contributor. Each day The Boock Report provides summaries and commentary on the macro data and news that matter, with analysis of what it all means and how it fits together.

Read More

Disclaimer - Peter Boockvar is an independent economist and market strategist. The Boock Report is independently produced by Peter Boockvar. Peter Boockvar is also the Chief Investment Officer of Bleakley Financial Group, LLC a Registered Investment Adviser. The Boock Report and Bleakley Financial Group, LLC are separate entities. Content contained in The Boock Report newsletters should not be construed as investment advice offered by Bleakley Financial Group, LLC or Peter Boockvar. This market commentary is for informational purposes only and is not meant to constitute a recommendation of any particular investment, security, portfolio of securities, transaction or investment strategy. The views expressed in this commentary should not be taken as advice to buy, sell or hold any security. To the extent any of the content published as part of this commentary may be deemed to be investment advice, such information is impersonal and not tailored to the investment needs of any specific person. No chart, graph, or other figure provided should be used to determine which securities to buy or sell. Consult your advisor about what is best for you.

Copyright © 2025 · The Boock Report · The Ticker District Network, LLC

  • Login
  • Free Content
  • TERMS OF SERVICE