• Skip to main content
  • Skip to primary sidebar
  • Skip to footer

The Boock Report

  • Home
  • Free Content
  • Login
  • Subscribe

July 27, 2016 By Peter Boockvar

Ongoing game of whether and when to hike measly 25 bps continues

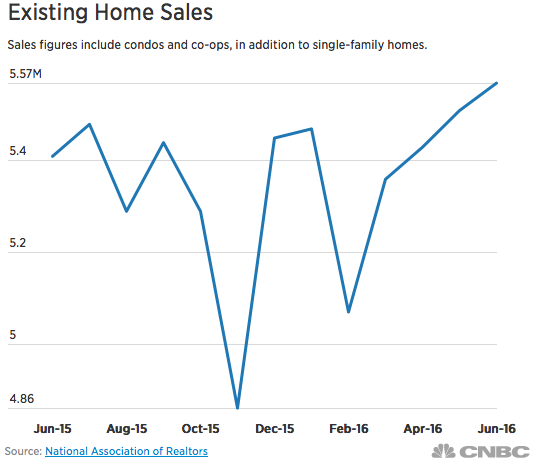
On the heels of the 287k print in June, the FOMC acknowledged this by saying “job gains were strong in June following weak growth in May.” They added this new line on the labor market that wasn’t there previously: “On balance, payrolls and other labor market indicators point to some increase in labor utilization in recent months.” They repeated that household spending was growing “strongly” but “business fixed investment has been soft.” They took out the line that “the housing sector has continued to improve” but I can’t figure out why. The benign inflation commentary was similar to the June meeting notwithstanding an 8 yr high in June core CPI at 2.3%.

Esther George, who did not dissent at the June meeting as she wanted to wait until after the UK vote, went back to voting for a rate hike of 25 bps.

Bottom line, we can call this a boring, non event meeting but there was a clear change to the hawkish side on the labor market commentary after the bounce back seen in June. This only brought the 3 month average to about 150k but the Fed seems intent on telling the markets that a September hike is a possibility. They do this not because they are intent to raise but to just give them flexibility with the markets as not to put them offsides if the data meets their rate hike threshold in coming months. Thus, this ongoing game of whether and when to hike a measly 25 bps continues. The 2 yr note yield at .74-.75% is down slightly from yesterday.

July 27, 2016 By Peter Boockvar

Durable Goods, Japan Stimulus, Fed Funds Futures, more…

Core durable goods orders, as measured by non defense capital goods ex aircraft, rose .2% m/o/m in June with May revised down by one tenth to a decline of .5%. It was in line with the estimate for up .2%. This measure of capital spending was still down 4.2% y/o/y and remains the missing piece of US economic activity. Durable goods ex transports were much weaker than expected as they fell .5% vs the estimate of up .3%. Also disappointing and will drag down Q2 GDP estimates was the .4% m/o/m drop in the shipments of core goods, well worse than the estimate of up .4%. Shipments of core goods are down 5.8% y/o/y. Looking at the main categories saw orders for vehicles/parts up by 2.6% m/o/m after falling by 3.1% in May and are higher by 2.1% y/o/y which is a pace that has slowed in line with the topping out of auto sales. Orders for electrical equipment also rose m/o/m but are down 6% y/o/y. Orders for machinery and metals fell.

Bottom line, capital spending remains punk as the modest .2% gain in June was off the weakest level since 2011 in May. Also as stated above, expect a cut in Q2 GDP estimates after the weak shipments number. Q2 GDP will be released on Friday and the estimate prior to today’s durable goods figure is 2.6% after the 1.1% gain in Q1. Thus, the first half GDP average will be most likely below 2% and will average about 1.75% over the past 4 quarters.

The stimulus trial balloons continue to fall in Japan with PM Abe saying it could total 28T yen (about $250b) with 13T of that in “fiscal measures.” Some of it will also be long term loans and it’s still unclear how much spending would be new and how much is just being repackaged to make it seem HUGE. The timing of this chatter was likely done purposely ahead of the BoJ meeting where Kuroda can have an idea of how much more paper he gets to now buy. He’ll be like a kid in the candy store. I’ll say again, this will just be more of the same and until there is more focus on the 3rd arrow, particularly labor and tax reform, the benefits will be fleeting. I’m most curious to see if the BoJ goes deeper with negative interest rates especially considering how badly received the first cut below zero was. After Abe’s comments the yen weakened to 106.5 vs the US dollar after trading as high as 104 yesterday morning but is now settling in at about 105.5. The Nikkei closed up by 1.7%.

In the US, mortgage applications to buy a home fell 3.3% w/o/w after falling 2% in the week prior. This brings the index to the lowest level since early March while still up 12% y/o/y. I’ll say again that the housing recovery continues but stats like this still point to the lumpy nature of it. Refi applications fell 15% w/o/w likely in response to the 4 week high in mortgage rates even though they still remain ridiculously low. They remain up 72% y/o/y.

Stock market sentiment according to II remained very positive. While bulls fell a touch to 53.9 from 54.4 last week which was the highest since April 2015 and compared to 52.5 in the week prior, bulls dropped to just 21.6 from 23.3 last week. That is the lowest in almost 3 months and brings the bull/bear spread to its widest since July 2015 at 32.3.

Ahead of the Fed, the December fed funds futures contract is pricing in a 46% chance of a hike by year end. In terms of other measures of the cost of money, 3 month LIBOR in case you hadn’t noticed is up to .73% vs .30% one year ago as money is shifting out of prime money market funds (big buyers of commercial paper) and into government treasury funds due to the upcoming regulatory changes. I’m trying to get a number on the trillions of dollars of LIBOR based loans in the US economy.

Reflecting worries about the UK vote and not capturing much after it, Q2 GDP in the UK rose .6% q/o/q and 2.2% y/o/y, both a tenth more than expected. That y/o/y gain was the best since Q2 of 2015 but we certainly know to expect a sharp slowdown in Q3. Also, the economy did seem to soften as Q2 progressed as April saw the most activity of the three months. The question is whether it’s just a short term knee jerk response to all the post referendum unknowns or something longer lasting because this whole process will take years. The pound is lower as are gilt yields and points to a response that knows Q2 is very old news in light of what has happened since. As evidence of this, the July UK retail sales CBI index fell to -14 from +4, the biggest drop in 4 years and it’s at the lowest level since early 2012.

In the 1st post UK vote consumer confidence numbers out of Germany and France saw a slight decline m/o/m. Consumer confidence in Italy rose 1.1 pts as did economic sentiment. While the economic impact seems to be immediate for the UK, the eurozone economies seem to be taking much more of a wait and see attitude.

Money supply growth in June in the eurozone rose 5% y/o/y, in line with the estimate and right in line with the average year to date. Household loans rose 1.7% y/o/y up a touch from the 1.6% gain seen in May and the same pace of gains were seen to non financial companies. These growth rates are the best since late 2011/early 2012. The new TLTRO program didn’t get started until the end of June. Bottom line, the cost of credit is certainly dirt cheap but the sustainability of net credit demand in the region is still uncertain as seen with the latest bank lending survey. As for bank profitability in making loans, the collapse in the yield curve of course doesn’t help and neither does deposit penalties paid to the ECB. We see the bank stress tests on Friday.

While almost every single global stock market rallied over night, the Shanghai index fell by 1.9% and the Shenzhen index was lower by 4.5% in response to talk that Chinese officials want to limit the amount of equities many of the banks wealth management products can buy. This area of the Chinese financial system has exploded in size and reach over the years and has led to a massive build up in leverage. I’ve seen estimates that WMP’s total $3.5T which is about 1/3 of the Chinese economy. The H share index wasn’t affected as it rallied .6%.

July 26, 2016 By Peter Boockvar

New Podcast – FOMC Preview: It’s the Central Bank’s World

I just sat down with Guy Adami and Dan Nathan for the first of many podcasts for The Boock Report. It’s about 45 minutes long and we cover the FOMC statement tomorrow, what other Central Banks like the ECB and BoJ are doing. And ultimately what it all means for the dollar, yields, commodities, equities and the economy as a whole. I specifically discuss what was in the last FOMC statement and what to look for tomorrow. I believe the Fed may start becoming more hawkish in there choice of language and that may have an effect on risk assets even though the market is pricing in such a small chance of rate hikes before the election in November. You can listen in on the entire discussion here:

Flash version:

Unable to display content. Adobe Flash is required.

MP3 version:

The following is the odds the market is placing on the path for the Fed for the balance of 2016. As you can see tomorrow’s meeting is basically in “no chance” territory. But things get more interesting into the end of the year:

Screen Shot 2016-07-26 at 11.24.05 AM

Screen Shot 2016-07-26 at 11.23.54 AM

Screen Shot 2016-07-26 at 11.24.14 AM

Screen Shot 2016-07-26 at 11.24.22 AM

Screen Shot 2016-07-26 at 11.24.36 AM


How about the data today ahead of tomorrow’s Fed Statement?

After a bad 2 yr note auction yesterday, the 5 yr today was equally poor. The yield of 1.18% was well above the when issued of 1.16-.165%. The bid to cover of 2.27 was below the previous 12 month average of 2.44 and the weakest in 7 years. Also, dealers got stuck with almost 42% of the auction vs the one year average of 33%. That is the most since August 2015.

Bottom line, the demand for short term US paper really dried up over the past 2 days. What is this saying about tomorrow’s Fed statement? What happened to the demand for yield? What happened to all that foreign buying? In response, the 2 yr note yield is touching .78%, exactly where it was the day of the UK referendum on June 23rd. The 5 yr yield of 1.15% compares with 1.26% on June 23rd and 1.07% on June 24th.

The yen is rallying to a 2 week high and is also at its pre Brexit level as stimulus junkies are realizing that the size of the fix may not be what they hoped for. To say expectations are high for another big round of stimulus is an understatement. The Japanese Finance Minister Aso said they are still unsure on the total size of the fiscal package and he also said monetary policy should be best left with the BoJ implying no coordination. For the all the focus on the 1st two arrows of Abenomics, the most important 3rd arrow has gotten completely lost unfortunately. Tax and labor market reform are the keys to faster economic growth, not more of the same on the fiscal and monetary front that has been essentially ongoing for decades. The Nikkei fell 1.4% overnight to a 2 week low.

The US 2 yr note yield is up another 1 bp to .75% after yesterday’s awful auction, the highest since the day of the June 23rd UK vote. The odds of a rate hike by yr end are also at the most since June 23rd at 46%. The 2s/10s spread is down another 4 bps and lower by 8 over the past 3 days to just 80 bps. It was at 96 bps on June 23rd. Today we see the July Markit PMI services index, July consumer confidence, July Richmond manufacturing survey and June new home sales.

In Europe, bank stocks continue to trade terribly with the Euro STOXX bank index back to a 2 week low led by a 5% decline in Commerzbank after an earnings update. Italian banks are weak as well. With the ongoing damage being done to the profitability of many global banks with interest rates where they are, how will it be possible not to see further economic weakness. We eagerly await the results of the ECB bank stress tests this week.

The pound is down slightly after BoE member Martin Weale said he is now leaning towards more monetary action (it stopped being an actual economic stimulant a while ago) after seeing the very weak PMI numbers last week. Just two weeks ago he said he was in no rush to act. Patience and humility with what they can do after everything that has already been done is still nowhere apparent. RBS is out today in a letter to its business clients that if the BoE goes down the NIRP road, it “could result in us charging interest on credit balances.”

Hong Kong exports fell for the 15th month in the past 16 y/o/y. They fell 1% in June from last year and that was a bit better than the estimate of down 1.6%. While China said imports from Hong Kong in June rose 71% y/o/y, Hong Kong said exports to China were up just 1.8% y/o/y. Hong Kong exports fell 7.3% to the US, by 10.3% to the UK and by 8.2% to Japan. Exports to Germany were up 1% y/o/y. Imports fell by .9% but that was much better than the forecast of a 5% drop. Looking ahead, the government said “the external trading environment remains challenging given the uncertainties associated with the outcome of the UK referendum in favor of leaving the European Union, slow recovery in the advanced markets, monetary policy divergence among major central banks and heightened geopolitical tensions in various regions.” The Hang Seng index was up by .6% and mainland indices rallied as well.

The Markit PMI services index for July slowed to 50.9, a 5 month low and down from 51.4 in June. It’s also the 2nd lowest print in years. New orders fell but employment was up slightly. Also, “business sentiment improved markedly from June’s record low.” Markit summed up the report by saying “The US service sector remained stuck in a low gear at the start of the third quarter of 2016, with growth of activity remaining subdued amid a slower rise in new business. This is particularly disappointing given the decent numbers posted by the manufacturing sector last week. A bit more encouraging was the rebound in business confidence following June’s survey low, suggesting that a return to stronger growth will be possible once the current soft patch comes to an end. Whether this will be before the presidential election or not remains to be seen, however.” As the market cares much more about the ISM figure, this figure is not a focus today but points to the still mediocre US economic growth rate.

The Conference Board’s consumer confidence index fell a hair to 97.3 in July from a revised 97.4 in June (revised from 98) but that was slightly better than the estimate of 96. The Present Situation component rose to the best level since September but Expectations moderated a touch. As for the answers to the labor market questions, those that said Jobs Were Plentiful fell .2 pts to a 5 month low but those that said jobs were Hard To Get were down by 1.4 pts. Overall employment expectations were about flat. After jumping by 1.7 pts in June, Income expectations fell by 1.6 pts. Consumer spending plans were subdued. Those that plan to buy a car fell almost 2 pts to the lowest level since October while those that plan to buy a home rose just .1 pt off the lowest level in a year. Also, buying plans of major household items rose only marginally from a 5 month low. One year inflation expectations fell one tenth to 4.7%. Business conditions were mixed to slightly better. Bottom line, the data is “suggesting the economy will continue to expand at a moderate pace” while “consumers remain cautiously optimistic about growth in the near term” according to the Conference Board.

New home sales in June totaled 592k annualized, 32k more than expected and up from 572k in May which was revised up by 21k. Sales now are at the most since February ’08 and continue to creep closer to the 25 yr average of 715k. Sales in the South and Northeast were flat m/o/m but lifted in the Midwest and West. As sales exceeded the increase in the number of homes for sale, months’ supply fell to 4.9 from 5.1. The median price was up by 6.1% y/o/y to back above $300k. Bottom line, with the dearth of inventory in some markets it is nice to see a lift in the sale of new homes but there still is a modest pace of sales for lower price homes where first time households need to see. A reason for that is the growing cost of lots, labor and fees that crimp the margins of selling a home for less than $250k. It was homes priced between $400-500k that saw the biggest lift as sales priced below that price fell m/o/m. I’ll say again, the housing market continues its recovery but still in an escalator type fashion rather than something more linear. In terms of historical rates, there still is a lot of catch up to be had.

The July Richmond manufacturing survey improved by 20 pts to +10, well better than the estimate of -5. Smoothing out the volatile nature of this number puts the year to date average to 4 vs 2 last year. New orders and shipments were up while backlogs were flat. Employment was up a touch and interestingly, “firms continue to report wage increases.” As for the future, “firms expected moderate growth in shipments and in the volume of new orders.” This included “mild growth in the number of employees.” Bottom line, Richmond has been the best manufacturing region so far in July as NY flat lined, Philly was down and Dallas was much less bad. Next week’s ISM is expected to print 53 vs 53.2 in June.

According to the Case Shiller home price index, prices fell for a 2nd straight month but only by the slightest amount. On a y/o/y basis, prices were higher by 5.2% but that was the slowest pace of gain since September. Robust price gains were seen in Portland, Seattle, Denver and Dallas. NY and DC were the main laggards. Bottom line, the seasonally adjusted 20 city index is just below the highest level since October ’07 and is just 9% from the 2006 peak. As I’ve stated in the past, I’m actually rooting for a slower pace of home price gains because too many households have been priced out. With persistent rent gains now reaching a point where monthly payments aren’t much different than mortgage payments, a slower pace of home price gains could help catalyze new purchases.


July 25, 2016 By Peter Boockvar

FOMC and BoJ Preview: Welcome to the Jungle

A few months ago I referred to monetary policy as entering a Jungleland where central bankers are essentially lost in the woods. After seeing Guns N Roses Saturday night, I’ll refer to this week as Welcome to the Jungle.

The week is all about the Fed and the BoJ. The key questions to be answered are will the former raise the possibility of a rate hike this year and will the latter amp up more of the same with the possible discussion of a perpetual bond. As for the Fed, let’s look at the June statement and how things have changed since:

What was said in June is bolded:

the pace of improvement in the labor market has slowed while growth in economic activity appears to have picked up.

Since then, the BLS printed a job gain for June of 287k on one hand but only an average of 150k over the past 3 months on the other. Technically speaking, the pace of job growth does continue to slow. As for the economy, on June 15th when the last statement was released, the Atlanta Fed GDPNow forecast was 2.7% for Q2. Today it sits at 2.4%. And that’s with a 60 point increase in the US Citi Surprise index.

Although the unemployment rate has declined, job gains have diminished.

The June unemployment rose and see above for the pace of job gains.

Growth in household spending has strengthened.

Since then retail sales data from the government was good but auto sales printed the 2nd lowest level of sales since early 2015 and here are some anecdotal retail comments from last week: Howard Shultz at SBUX on weaker comps than expected, “No one should misinterpret or in any way look at the challenges that we and many, many other companies are facing as something that has been done before. This is quite unusual. It’s unsettling.” Dunkin Donuts CEO said “consumers had gone into a bit of a funk during the quarter.” The YUM CEO said the US was in a “malaise” and quarterly sales were soft. He cited a June survey by GenForward of 18-30 yr olds that said ¾ of them “said they believed the US was in decline… not particularly good news from what people are thinking.”

Since the beginning of the year, the housing sector has continued to improve and the drag from net exports appears to have lessened, but business fixed investment has been soft.

Housing continues with its improvement, albeit bumpy still. Net exports are still a drag and business investment sucks to be perfectly blunt.

Inflation has continued to run below the Committee’s 2 percent longer-run objective, partly reflecting earlier declines in energy prices and in prices of non-energy imports.

Headline inflation remains well below for sure but June core CPI printed 2.3% for freaking sake, an 8 year high. How about an acknowledgement on the part of the Fed. Yes, I acknowledge the pressure on goods prices but services inflation is widespread. The Atlanta Fed wage tracker printed up 3.6% on June 14th (this data point was most likely not in the Fed staff report for the statement on June 15th), the highest since December 2008.

Market-based measures of inflation compensation declined; most survey-based measures of longer-term inflation expectations are little changed, on balance, in recent months.

The 10 yr inflation breakeven at 1.51% is little changed with the June 15th closing print of 1.50%. This stat mostly follows commodity prices anyway.

Finally…

In determining the timing and size of future adjustments to the target range for the federal funds rate” they will assess “labor market conditions, indicators of inflation pressures and inflation expectations, and readings on financial and international developments.

  1. Labor market conditions: Will they solely look at the June print or average the past 3 months together?
  2. Inflation: Does core CPI matter to them at all? Does Dennis Lockhart tell them about his bank’s wage data?
  3. Financial and international developments: The S&P 500 is at an all time high with valuation comparisons to 1929 and 2000. As for high yield bonds, Martin Fridson, the well known high yield analyst (I’m quoting WSJ here) said this week “Factoring in interest rates, economic conditions and the availability of credit, Mr. Fridson calculates that in only 9 months over the past 2 decades have yield bonds been more overpriced than today.” International developments cut both ways, China is perceived to be stabilized for the sole reason of massive credit growth and fiscal stimulus while Europe post referendum is one big question mark.

Bottom line: The Fed has every reason to wake the markets up to a possibility of a rate hike soon but then again, it depends on how they look at the data and/or the 3rd mandate, the markets.

As for the BoJ and the possibility of more QE, whatever form it might take and whatever Abe has up his sleeve, I only can leave you with this picture:

groundhog-day-ftr1

For those historians, the BoJ first tried QE in 2001.

********

I’ll be hosting a webinar tomorrow, previewing the FOMC decision and discussing The Boock Report product which you can participate in as a free preview. Registration for the webinar and The Boock Report is free, with no obligation and no credit card required.

REGISTER FOR THE WEBINAR AND THE BOOCK REPORT HERE

July 22, 2016 By Peter Boockvar

7/22 – A Succinct Summary of the Week’s Events

Positives:

  1. Initial jobless claims remained very low at 253k, 12k less than expected and little changed with last week’s print of 254k. This brings the 4 week average down to 258k from 259k last week and near a level seen 3 months ago. Delayed by a week, continuing claims fell by 25k after rising by 36k last week.
  2. The Markit’s index of US manufacturing for July was 52.9 up from 51.3 in June. It’s the best level since October. Markit said “July data signaled a further rebound in business conditions across the US manufacturing sector, led by a robust expansion of incoming new work and the fastest upturn in production volumes for 8 months. Job creation also strengthened in July, with the latest increase in payroll numbers the fastest seen over the past 12 months.” Export orders were softer implying that the improvement was all domestic. Markit concluded by saying “It remains too early to say if this is the start of a stronger upturn, but this is a welcome and encouraging sign of revival after the second quarter in which the PMI signaled the sector’s worst performance for over six years.”
  3. Existing home sales in June totaled 5.57mm, almost 100k more than expected while May was revised down by 20k to 5.51mm. This is the highest level of sales since February ’07. Months’ supply remained modest at 4.6 months vs 4.7 in May. The median home price was up by 4.8% y/o/y to the most on record as higher priced homes dominated the mix. First time buyers made up 33% of sales which is the most in almost 4 years, up from 30% in May and 32% in April but still below the historical average of about 40%.
  4. June housing permits were about in line with expectations. Single family permits were up by 7k to 738k which is slightly above the average this year of 733k. Multi family permits totaled 415k, up 10k m/o/m and a touch above the 6 month average of 409k.
  5. The Eurozone services and manufacturing composite index saw only a modest fall to 52.9 from 53.1 in June and vs the estimate of 52.5. By .1 pts, it is the lowest since January ’15 with both components down m/o/m.  “The eurozone economy showed surprising resilience in the face of the UK’s vote to leave the EU and another terrorist attack in France. The overall rate of economic growth is largely unchanged, suggesting GDP is growing at a sluggish but reasonably steady annual rate of around 1.5%.” Employment was a particular bright spot within the data.
  6. Prior to the UK referendum, the UK economy added a net 176k jobs for the 3 months ended May, well more than expectations of 73k and the unemployment rate fell to 4.9% from 5%. That is a new low in this cycle and touches the lowest level since September 2005.
  7. Taken after the UK referendum vote, French business confidence for July rose 2 pts to 102 to match the best level since 2011 and back to where it was in May. The long term average is 100 and was as high as 115 pre recession.
  8. The July Markit Japanese manufacturing PMI index rose to 49 from 48.1 but is still the 5th straight month below 50.

Negatives:

  1. The Philly index went negative to -2.9. That is below the estimate of +4.5 and down from +4.7 in June. The components however were in conflict with the headline number for the 2nd straight month with July for the better and June for the worse. The business activity 6 month outlook rose 4 pts but only after dropping by 6 pts in June.
  2. With the 20 bps jump in the 10 yr note yield last week, there was a 5 bps increase in the average 30 yr mortgage rate to 3.65% off last week’s 3 yr low. After spiking in the two prior weeks, refi applications fell .9% w/o/w but are still up 105% y/o/y. Purchase applications fell 2% but remain up almost 16% y/o/y.
  3. Housing starts in June totaled 1.189mm which was 24k more than expected but May was revised down by 29k and April was lower by 12k so let’s call it a miss. For single family, starts were 778k from 745k in May which was revised down by 19k. That 778k figure is about in line with the 6 month average of 776k but remains well below the 25 yr average of about 1mm. Multi family starts totaled 411k, the most since September which compares with the 6 month average of 379k.
  4. The UK services and manufacturing composite index fell to 47.7, the weakest level since early 2009 from 52.4 in June. “Output and new orders both fell for the first time since the end of 2012, while service providers’ optimism about the coming 12 months slumped to a 7 ½ yr low…A number of firms linked this to ongoing uncertainty pre and post EU referendum, with reports especially prevalent among service providers.”
  5. Mostly conducted pre vote (survey done between May 29th and July 2nd), UK retail sales in June ex auto fuels fell .9% m/o/m, a bit more than the estimate of down .6% after a .9% gain in May. The y/o/y gain slowed to 3.9% from 5.2% in May.
  6. UK jobless claims in June rose .4k, below the estimate of an increase of 3.5k but May was revised much higher, by 12.6k.
  7. Even before the impact from the sharp decline in the pound at the end of June starts to show up in the data, headline consumer price inflation in the UK rose .5% y/o/y and the core rate was higher by 1.4%, both one tenth more than expected. The core rate was just one tenth from matching the highest level since August 2014 as services inflation was higher by 2.8% y/o/y.
  8. The ZEW July index fell from +19.2 to -6.8 which was well below the estimate of +9.0 and the worst print since November 2012. The Current Situation fell to 49.8 from 54.5. That is the 2nd lowest read since early 2015. The ZEW President said “The Brexit vote has surprised the majority of financial market experts. Uncertainty about the vote’s consequences for the German economy is largely responsible for the substantial decline in economic sentiment. In particular, concerns about the export prospects and the stability of the European banking and financial system are likely to be a burden on the economic outlook.” For the Eurozone as a whole, Economic Sentiment fell to -14.7, the weakest since August 2012 from +20.2 last month.
  9. The number of price gains in 70 China cities surveyed moderated on a m/o/m basis. For new apartments, prices rose in 55 cities in June vs 60 in May and 65 in April. In December there 39 cities that saw price increases. For existing apartments prices rose in 48 cities, down 1 from May and down 3 from April. In December it was at 37. On a y/o/y basis for both new and existing apartments however, prices grew in even more cities than the month prior. Price gains are still out of control in the major cities with Shenzhen seeing a 47% y/o/y increase but that is actually down from 53% in May. Prices in Shanghai were up 28% vs last year, the same pace as the prior month and they were higher by 20% in Beijing.
  • « Previous Page
  • Page 1
  • …
  • Page 651
  • Page 652
  • Page 653

Primary Sidebar

Recent

  • July 1, 2023 The Boock Report is now On Substack
  • June 6, 2023 Travel remains strong and the credit crunch is on
  • Subscribe
  • Free Content
  • Login
  • Ask Peter

Categories

  • Central Banks
  • Free Access
  • Latest Data
  • Podcasts
  • Uncategorized
  • Weekly Summary

Footer

Search

Follow Peter

  • Facebook
  • LinkedIn
  • Twitter

Subscribe

About Peter

Peter is the Chief Investment Officer at Bleakley Advisory Group and is a CNBC contributor. Each day The Boock Report provides summaries and commentary on the macro data and news that matter, with analysis of what it all means and how it fits together.

Read More

Disclaimer - Peter Boockvar is an independent economist and market strategist. The Boock Report is independently produced by Peter Boockvar. Peter Boockvar is also the Chief Investment Officer of Bleakley Financial Group, LLC a Registered Investment Adviser. The Boock Report and Bleakley Financial Group, LLC are separate entities. Content contained in The Boock Report newsletters should not be construed as investment advice offered by Bleakley Financial Group, LLC or Peter Boockvar. This market commentary is for informational purposes only and is not meant to constitute a recommendation of any particular investment, security, portfolio of securities, transaction or investment strategy. The views expressed in this commentary should not be taken as advice to buy, sell or hold any security. To the extent any of the content published as part of this commentary may be deemed to be investment advice, such information is impersonal and not tailored to the investment needs of any specific person. No chart, graph, or other figure provided should be used to determine which securities to buy or sell. Consult your advisor about what is best for you.

Copyright © 2025 · The Boock Report · The Ticker District Network, LLC

  • Login
  • Free Content
  • TERMS OF SERVICE